Weekly Market Makers

A Negative Space in a Positive Outlook

A Negative Space in a Positive Outlook

Currently, nearly 30 percent of the world's sovereign debt has a negative yield. Said differently, owners of $7 trillion worth of government bonds issued by countries all over the world will get less money than they invested if they hold the bond to maturity.

A New Day Yesterday

A New Day Yesterday

With U.S. large cap stocks down over 10 percent, it hasn’t been a happy new year for investors. The Fed tried to alleviate fears this week on Capitol Hill by stating that they realize the current volatility may lead to slower economic growth and thus there will be no March rate hike. While the talking heads weren’t impressed with the statement, we believe that it was a positive and highlighted the fact

Staying the Course

Staying the Course

At first glance, what some investors thought might by a perfect U.S. labor report for January met with a resounding thud in financial markets Friday.  It seemed to be one without so many jobs created that the Fed would be forced into raising rates at an uncomfortably fast pace, yet a report that was still strong enough to

Earnings Season Underway

Earnings Season Underway

As of Thursday this week, roughly one-third of the S&P 500 companies have reported earnings for the fourth quarter of 2016. Of the 171 companies that have reported earnings 8 percent were in-line with expectations, 19 percent had a negative surprise and 72.6 percent reported a positive

Rescue Me

Rescue Me

That’s the message we heard loud and clear from the markets this week.  As economies and markets around the world wobble to start the new year, they were looking to central banks to bail them out. Mario Draghi gave markets around the world some solace with his dovish news conference yesterday.

Under Pressure

Under Pressure

Earlier this week we lost a music icon. While I was not a big fan of David Bowie, there are a few songs of his that I enjoy. My favorite is “Under Pressure” which he co-wrote with the band Queen in 1981. The title is very appropriate for what we

Happy New Year (?)

Happy New Year (?)

As we observe U.S. stocks down roughly 5 percent in the first week of 2016, we are reminded of what occurred last fall when Chinese growth concerns and a strong dollar reverberated around the globe. While China accounts for only

Time Is On My Side

Time Is On My Side

Santa Claus left investors with a lump of coal this December. Historically, the S&P 500 is positive in the month of December with a return of roughly 2 percent. 2015 resulted in a flat return, summing up the entire year for investors. There

Junk Bonds on the Naughty List

Brad-00447-cmykby Brad Houle, CFAExecutive Vice President

Last week, Third Avenue Management announced that they were freezing withdrawals from a leveraged credit fund. This announcement sent a wave of fear of broader contagion through the high-yield bond market. This fund bought bonds that were both illiquid and very risky from a credit quality perspective. Also, the fund employed leverage (borrowed money) in an attempt to enhance returns. This fund was swinging for the fences and not for risk adverse investors. This turbulence has bled over into the broader category of below investment grade bonds also referred to as high-yield.

Bonds that are below investment grade are often referred to as junk bonds due to the lower credit quality of the issuing companies. Junk bond is a somewhat of a pejorative description of an important part of the bond market. Small companies that are growing, a large engine for the U.S. economy, often fit into the category of below investment grade credit. It is important that there are public market debt financing options available for these entities. Because of the lower credit quality, investors demand more compensation in the form of interest in order to loan these companies money. Due to the lower credit quality there is a higher potential default risk for these bonds.

The genesis of this recent sell-off in the high-yield bond market has been the decline in the price of oil. Many smaller oil and gas companies use the high-yield debt market to finance their operations. When the price of oil declines these small oil and gas companies make less money and have more difficulty paying back the money they have borrowed. As a result, the prices on high-yield bonds in that segment of the market declined. Retail investors in mutual funds became nervous, withdrawing money from high-yield mutual funds and, to meet redemptions, the fund managers had to sell what they could to meet the investor demand for money. This dynamic has caused other parts of the high-yield bond market to decline as well.

Another wrinkle to this negative situation has been the decline in liquidity in the bond market. The Dodd-Frank Wall Street Reform and Consumer Protection Act that came from the financial crisis with the intention of reforming Wall Street has helped to create this predicament. Dodd-Frank severely limits the ability of large bank bond trading departments to inventory bonds, making building an effective market difficult due to capital requirements.

The higher quality investment grade market is where we invest our clients’ fixed income assets. Thus far, the investment grade bond market has only been modestly impacted by the sell-off. By comparison, the Barclays High Yield Index has declined 4.7 percent this year versus the Barclays Investment Grade Intermediate Credit Index which has returned 1 percent.

Our Takeaways from the Week

  • We don’t believe that the current disruption in the high-yield bond market will cause a broader contagion in the financial markets
  • We are particularly keeping a close eye on investment grade bonds where we have seen only a minor impact
  • This week the Federal Reserve hiked rates for the first time in nine years and we continue to expect a slow and gradual rise in the Fed funds rate and interest rates in general
  • We believe that this interest rate increase cycle will not end the bull market or push the economy into recession

Disclosures

The Time Has Come

Shawn-00397_cmykby Shawn Narancich, CFAExecutive Vice President of Research


Awaiting Lift-Off

Following last week’s solid jobs report, a clear plurality of investors now expect the Federal Reserve to raise short-term interest rates next week. But once the Fed has achieved lift-off, what then? Amid ongoing dollar strength and falling energy prices, corporate profits have stagnated this year and economic growth remains pedestrian, causing concern about more of the same in 2016, but with less monetary accommodation along the way. We expect the path of Fed rate tightening to be gradual because inflation remains nearly non-existent. Even excluding food and fuel prices, so called “core inflation” also remains notably below the Fed’s 2 percent objective.

Mission Partly Accomplished

What we do have, and what is leading to the end of zero interest rate policy, is a state of relatively full employment. Although the labor force participation rate remains near decade low levels, the Fed rightfully sees its full employment mandate as having been achieved. In turn, we have seen stirrings of labor cost inflation, both statistically and anecdotally. The employment cost index is finally nearing 3 percent after having spent a prolonged stretch below that mark. Real life examples include fast food restaurants like McDonald’s and retailers Wal-Mart and TJ Maxx having to boost wage rates to keep employees; the degree to which labor inflation takes hold more broadly will be important to gauge, as this combined with the productivity of labor determine what we believe to be the single most enduring predictor of consumer price inflation – unit labor costs.  Perhaps because of muted levels of capital spending later in the economic cycle, workers’ productivity has proven to be disappointing in recent quarters, increasing upward risk to this key measure. As the Yellen Fed achieves lift-off from zero percent interest rates, it will be closely tracking its labor force dashboard in helping to determine how fast and how high rates ultimately go.

OPEC Laissez-Faire

OPEC finished its latest and much anticipated meeting in Austria last Friday much like we expected, acceding to the current level of the 12-member cartel’s production, but apparently not making any plans to accommodate additional liftings from Iran once UN sanctions are lifted, as expected sometime early next year. While some thought OPEC would cut production, this outcome never seemed likely. Lead producer Saudi Arabia’s strategy has come into focus – keep oil prices low enough, long enough, to accommodate its recapture of market share and stimulate enough additional demand to tighten oil markets naturally. In essence, the cartel has ceased to act as one. By all accounts, the meeting was highly contentious and unusually long, the result of discord that saw members Venezuela, Nigeria and Ecuador argue unsuccessfully for reduced liftings.

Black Gold?

Oil prices fell on the news last Friday and have proceeded to breach late August support levels of $40/barrel. Not helping oil bulls’ cause is news this week that Iraqi production gains have boosted OPEC production to fresh three-year highs in November at the same time the El Nino weather phenomenon has warmed the Northern Hemisphere and squelched early season demand for heating oil, an important seasonal product of crude oil. These headwinds notwithstanding, we maintain our belief that oil markets will tighten as U.S. production continues to roll over, non-OPEC, ex-U.S. production stagnates, and oil demand again grows at a faster than anticipated clip. Barring a market share war within OPEC (one that would be fought with limited means given how little excess production capacity the cartel has), Saudi’s de facto strategy appears destined to succeed. We see modest levels of oversupply morphing into undersupply as 2016 progresses. After all, the following adage holds – the best cure for low oil prices is low oil prices.

Our Takeaways from the Week

  • The long awaited Fed lift-off from zero interest rate policy is at hand
  • Oil prices have fallen anew in the aftermath of OPEC’s highly anticipated meeting last week

Disclosures

Inflation Is Like Wine

Brad-00447-cmykby Brad Houle, CFAExecutive Vice President

This week, a few of us at Ferguson Wellman had the opportunity to attend a lunch presentation where Dr. John Williams, president of the Federal Reserve Bank of San Francisco, was speaking.

He started his remarks with a disclaimer that everything he was about to say was his own opinion and not the opinion of the Federal Reserve. That said, one can imagine that there are detailed guidelines around what Fed Governors can say in a public setting.

“Jawboning” is an expression for the Fed communicating its intentions to the market. Dr. Williams’ comments were being reported in real time on Bloomberg as well as other financial media outlets. These days, what the Fed says it is going to do is as important or more important that what it actually does. This week, Dr. Williams conveyed the message that the Fed was going to raise rates at the next Fed meeting without actually saying so.

One of the takeaways from the presentation was the how the Fed thinks about inflation and the lag between monetary policy changes and the actual impact. Dr. Williams said this about inflation: "The inflation side of the equation is where the winds are blowing colder than I’d like.” For those of us who lived through the ’70s and ’80s, the need for higher inflation seems anathema to a healthy economy, but that’s where we are right now. He also said, “Inflation is like wine … a little bit is actually good for you.”

With respect to the lag between monetary policy changes and the impact, Dr. Williams said, "Milton Friedman famously taught us that monetary policy has long and variable lags. Research shows it takes at least a year or two for it to have its full effect."  Looking at the current inflation data in the context of this logic supports why the Fed will most likely raise interest rates even if inflation is below the 2 percent target.

There was a question from the audience regarding the notion that economic data is backward looking, yet Fed Governors are tasked with being forward looking. How would they reconcile the two? Dr. Williams shared how the Federal Reserve Governors are regionally based with volunteer boards within their districts. He said that they spend a lot of time speaking with business owners, bankers and other community leaders who live in the district. These efforts are a critical source of forward-looking information for the Fed.

Communication from the Federal Reserve increased greatly under Chairman Bernanke and has continued under the Yellen Fed. It was fascinating to glimpse a small step in the Fed's painstaking and deliberate communication with the financial markets.

With that, today’s U.S. jobs market report of 211,000 new jobs in November seems to seal the deal that interest rates are going to rise this month. The market responded favorably today with a 2 percent rally in the S&P 500 and the U.S. dollar strengthening as well. This confirms that, in addition to comments from the Fed, when economic data speaks – the markets listen.

Our Takeaways from the Week

  • We anticipate an interest rate hike from the Fed in two weeks, albeit gradual
  • The economy continues to grow at a steady, healthy pace

Disclosures

Who Says You Can’t Go Home?

Ralph-00338_cmykby Ralph Cole, CFAExecutive Vice President of Research

Homeward Bound

Thanksgiving is the busiest travel time of the year. Families are crisscrossing the country returning to their childhood homes to celebrate the holiday. And one thing we should all be thankful for is a healthy housing market.

Earlier this week it was reported that the S&P 500/Case-Shiller Home Price index rose 5.5 percent from the prior year. Home prices remain 20 percent below levels reached in 2006 on average, but what is more important than the home price level is the change from one cycle to the next. From 2000 through 2006, home prices doubled at an unsustainable pace and we all paid the price. The current cycle is much more measured and thus, much more durable in our mind.

Chart 1

Home Is What You Make It

Prices are just one part of the overall housing equation. Below you can see housing starts for the past 30 years. Housing starts in the U.S. are just now barely above levels reached at the bottom of the last housing cycle in 1990. The first few years after the housing crash we experienced low rates of construction before it finally started to accelerate in late 2011.

Housing Units Started, Total

The Incredible Journey

A continued rise in housing starts is needed to offset continued strong demand for new homes. If supply were too low, we would expect home prices to accelerate at a faster pace, making them less affordable. To this point, the market seems to be in balance.

Takeaways for the week

  • The housing market is on much sounder footing this time around
  • Have a safe and healthy Thanksgiving Holiday

Disclosures

Back in Business Again

Jason-00011_cmykby Jason Norris, CFAExecutive Vice President of Research


Back in Business Again

It has been a volatile year for equities and as we head into the holiday season, that doesn’t look to dissipate. After the 12 percent sell-off investors went through over the past few months (Fed rate hike concerns, China market crash, Greek debt issues and the constant geo-political flare-ups), the S&P 500 has rallied back, culminating with its best week of the year. While 2014 proved to be a narrow market, 2015 is even more so. When you look at the 10 largest U.S. companies (see table below), you notice the majority of them, have enjoyed significantly greater returns than the 3 percent for the S&P 500.

first image


Source: FactSet data through Nov 20, 2015

What is even more dramatic is that three stocks were responsible for all of this return: Amazon, Alphabet/Google and Facebook.

There have been prior periods of large cap driven markets, coupled with a handful of names driving that performance. But what we have experienced this year is less than a handful of mega cap names delivering all the index returns.

One thing to note on this narrow focus is the emphasis on “growth.” The sell-off we experienced this summer was a classic “growth” scare. Investors believed that due to the strong dollar and the slowdown in China would cause global economic growth to slow. While we’ve seen some stabilization in the equity market, there is still concern over global economic growth. As such, investors have been willing to “pay up” for growth companies and avoid cheaper names that are tied to the face of economic growth. For instance, the three stocks mentioned earlier trade at substantial premiums to the overall market.

second image


Source: FactSet data through Nov 20, 2015

Investors are paying a lot more for a  dollar of earnings for a select few names due to the concern over growth. This has resulted in growth stocks returning roughly 7 percent this year, while value stocks are down 2 percent.

Takeaways for the Week:

  • Different “styles” can come in and out of favor, the key is to remain focused on the long term and not chase short-term performance
  • As the global economy improves, value stocks should regain some leadership in 2016

Our Takeaways for the Week

Disclosures

A Lack of Household Formation Participation Trophies

Brad-00447-cmyk by Brad Houle, CFA Executive Vice President

Millennials get a bad rap. They are characterized as the generation that was born between 1980 and 2000 and are often considered to be indulged and coddled. They are often accused of being the by-products of a society where everyone receives a participation trophy. This is quite different than the baby boomer generation, born at the end of World War II through the mid-60s and often considered wealthy, active and the result of an economic boom. And while the millennial birth rate in 1990 matched the 1957 baby boomer birth rate with greater than 4 million births, similarities between the two generations begin and end there.

Following the baby boom of the 1950s, there was a significant pick up in household formations roughly 20 years later. Consumer spending on the acquisition of homes, furniture and other durable goods define household formations, which makes up almost 70 percent of our gross domestic product or, said differently, our national income. This consumer consumption of household formation drives the economy and the millennials cannot keep up the pace. According to Federal Reserve data from 1997 to 2007, about 1.5 million households were formed on average each year in the United States. Then the Great Recession hit, and in the ensuing three years, the rate fell to 500,000 per year.

In addition, the Great Recession resulted in a drop in millennial independent living. The Pew Research Center, in the first third of 2015, found that 67 percent of millennials were living independently, compared with 69 percent of 18-to-34 year olds living apart from family in 2010 and 71 percent in 2007. Also, unemployment in the millennial demographic shot up over 12 percent during the recession. Moving back in with Mom and Dad and/or possibly pursuing further education became a viable option for many in the group.

Today we learned that current unemployment has dropped to around 5 percent. This begs the question: If unemployment has improved, why are millennials still so reluctant to leave the nest? The rising cost of tuition, the student loan debt that results and an increased home down payment are thought to be a few of the culprits of these nest-bound millennials. The College Board, responsible for several standardized college tests such as the SAT, points out that the average “published tuition and fees at public four-year colleges and universities increased by 13 percent in 2015 dollars over the five years from 2010-2011 to 2015-2016, following a 24 percent increase between 2005-2006 and 2010-2011.” As a result, according to the Brookings Institute, the average balance of outstanding student loan debt for households with some debt was $25,700. In addition, following the financial crisis the required down payment on a home was raised to 20 percent. Considering these factors, it is possible this generation is making rational economic choices by living at home as opposed to a desire to have their parents clean their room for them.

Ned Davis Research estimates that there are roughly 3 million incremental millennial households that have yet to be formed. As millennials leave the comfort of their parent's basement, pay off their student debt and join the real world, this household formation could be a tailwind for the housing market as well as the consumer economy.

The employment report for the month of October was released on Friday and was much better than expected. 271,000 jobs were created in October and there was an upward revision to the number of jobs created in the prior month. As mentioned earlier, unemployment dropped to 5 percent and the average hourly earnings was up more than expected rising 2.5 percent on a year-over-year basis. With this stronger-than-expected data the implied probability of a Federal Reserve rate increase is now at 70 percent for the month of December.

Our Takeaways from the Week

  • Employment numbers positive
  • More anticipation of movement with the millennial generation that could be a tailwind for consumer spending

Disclosures

Monster Mash

Ralph-00338_cmykby Ralph Cole, CFAExecutive Vice President of Research

Monster Mash

No holiday better describes earnings season than Halloween.  When companies announce earnings, investors are hoping for treats but often times end up getting tricks. In our view, improving corporate earnings are the catalyst to improving stock market returns in the coming year. As we close out the best month for the stock market since 2011, we should review some of the tricks and treats of earnings season.

Treat

Apple reported earnings earlier this week and beat expectations on almost every level. IPhone sales continue to grow at a robust pace around the world. The company sold 48 million iPhones in the third quarter, up 22 percent from last year. Analysts expect the company to sell 79 million iPhones in the final quarter of the year.  Average selling prices of the phones continue to rise, which enhances profitability and will lead to $60 billion in free cash flow this year alone.

Tricks

As expected, the energy sector has had a rough time of it this earnings season. Earnings for the S&P 500 energy sector were expected to be down 73 percent this quarter and that indeed has been the case. During these distressing times all companies begin to dramatically scale back investment and reduce headcount. We feel that higher quality companies with good assets, low debt levels and quality management teams will benefit from the eventual rise in oil prices.

Trick and Treat

In no place is the bifurcations of earnings season more evident than in footwear. Nike reported earnings that beat analyst estimates by 12 percent and the stock responded with a nine percent pop the next day. Nike also reported a solid outlook for the coming quarters as well. Sketchers, on the other hand, tricked investors and missed earnings by a whopping 21 percent last week and the stock dropped 31.5 percent with the news.

Why have stocks responded so positively to a mixed earnings environment? Expectations for third quarter earnings had been lowered so much that companies have been able to meet and often beat those reduced forecasts. Also, the much advertised slowdown in China has not had as big of an impact on earnings as investors feared. While the investment slowdown in China has hurt some industrial companies, the Chinese consumer has actually helped the likes of both Apple and Nike.

Takeaways for the week

  • There have been more treats than tricks this earnings season which has driven the S&P 500 higher by nine percent this month
  • Earnings season continues to be very volatile and stock selection has been key

Disclosures

May Days and Where Fall May End Up

Jason-00011_cmykby Jason Norris, CFAExecutive Vice President of Research

Volatility reigned supreme over the summer. The old Wall Street adage of, “Sell in May and go away,” was prophetic in 2015. Investors had become somewhat complacent the first several months of the year. The market was trading in a relatively tight range and volatility was at a minimum. In mid-May, the S&P 500 closed its all-time high of 2,130.82. As we rolled into June, the media was posing the question, “Should investors sell and move to the sidelines?” June through September is historically the worst period for investing; however, stocks are still positive. Selling in May and going away, in hindsight, would have been the right move. Emerging markets, notably China, Russia and Brazil, began to cause concerns. A major selloff in Chinese equities, lower-than-expected economic growth and a currency devaluation resulted in a major sell off in equities globally. The S&P 500 hit a low of 1,867 for the year at the end August and volatility increased meaningfully. During this period, we had to remind clients that volatility is very common; we have just been in a period of low volatility. In 2013 and 2014, only 15 percent of the time, the S&P 500 was up or down over 1 percent. In 2015, that is closer to 25 percent, which is more in-line with the long-term average. Also, the chart below highlights intra-year volatility; however on average, stocks are still positive.

Capture

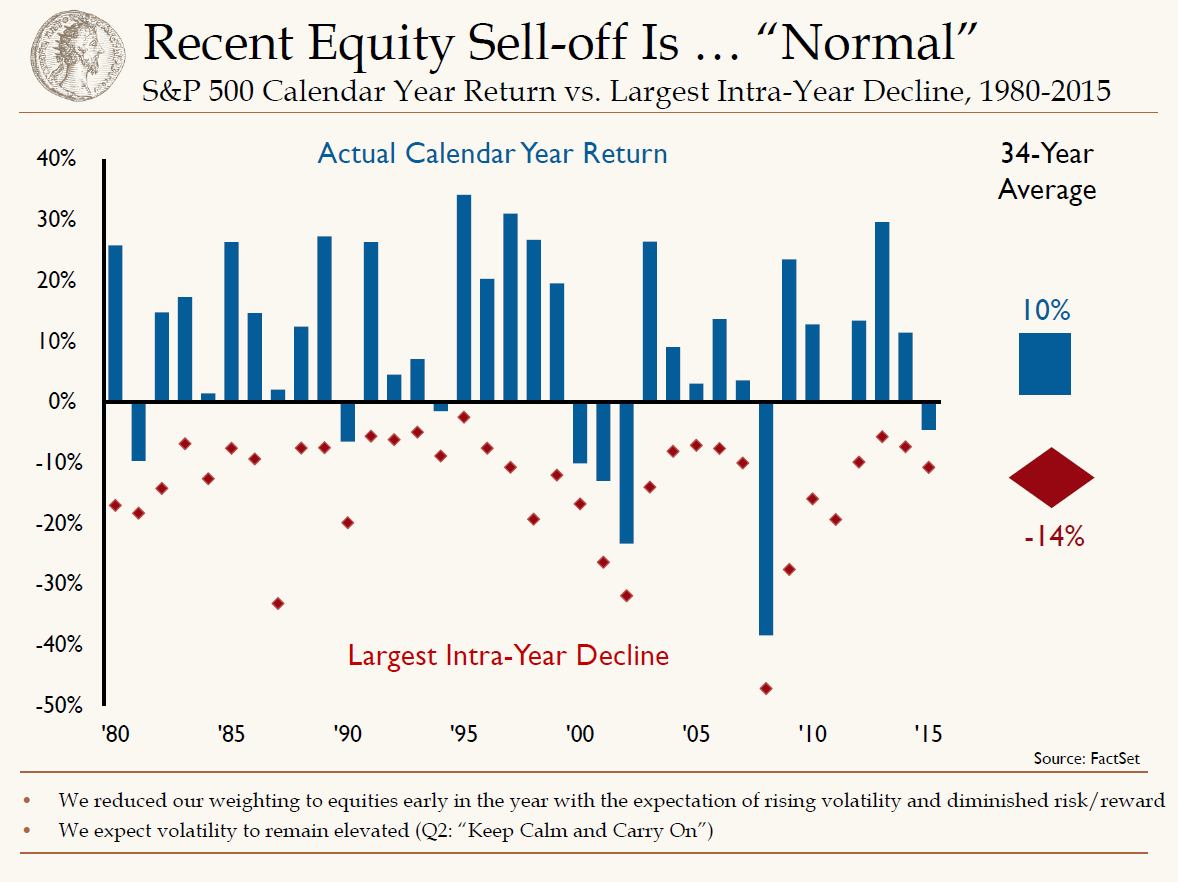
Over the last 35 years, the average largest intra-year decline has been 14 percent, as shown by the red diamonds. Even in the face of these declines and volatility, the average return for the S&P 500 is 10 percent. This year, we saw a 12 percent drop from peak to trough and we believe that we have already seen the lows of 2015.

As we move into earnings season, the S&P 500 is roughly flat on the year. The volatility experienced in the summer continues as investors sort out exactly how slow global, primarily emerging market, economic growth is? How healthy is the U.S. consumer? And when will the Federal Reserve finally raise interest rates?

Regarding the Fed, the market is discounting a 30 percent chance of a December rate hike. While the employment picture in the U.S. continues to improve, low inflation and global uncertainty has kept the Fed on the sidelines. We believe that the likelihood is closer to 50/50 for a year-end rate. Whenever it occurs, the pace will be a lot slower than previous tightening cycles.

The emerging markets continue to be a headwind to U.S. growth. With recessions in Russia and Brazil, coupled with massive currency devaluations, U.S. exports continue to struggle in those markets. China, while still growing, is slowing. Earlier this month, the Chinese reported GDP growth of 6.9 percent for the third quarter. We believe that the real growth is lower, but positive. The primary slowdown is coming from the industrial areas, while the consumer continues to remain relatively strong. We’ve seen this in the individual companies we follow. For instance, Caterpillar is showing major declines in their business in China, while Apple and Nike are still experiencing growth.

Finally, while exports to emerging markets have been a headwind for the U.S. economy, the key factor is still the consumer. We believe that the state of the U.S. consumer is strong and continues to get better. Consumer confidence is high and wages are slowly moving up. The factor that we are not yet seeing on a meaningful basis is increased spending. The drop in gas prices has resulted in consumers paying down debt, rather than spending more. We believe that eventually this savings will be deployed into the economy as gas prices remain. This will result in an additional tailwind for U.S. economic growth.

With this backdrop, we believe that with interest rates rising and U.S. economy delivering healthy growth, investors should not shy away from equities. If they got out of the market earlier this year due to the volatility, we would be putting those funds back to work.

Our Takeaways for the Week

  • Volatility is more common than investors perceive
  • We continue to be positive on the U.S. economy and consumer

Disclosures

Opening the Floodgates

Shawn-00397_cmykby Shawn Narancich, CFAExecutive Vice President of Research

All Over the Board

Investors anxious to put concerns about the broader economy behind them and focus on the “micro” view of company earnings were treated to a barrage of numbers this week that varied in impact as far and as wide as the industries represented. In many ways, what investors are seeing in the early days of earnings season is representative of key themes year-to-date: heightened levels of mergers and acquisitions are exemplified by Dell’s record-breaking $67 billion deal for EMC, hit-or-miss economic data that once again has Wall Street prognosticators pushing the first Fed rate hike further into the future, and an earnings picture that’s as eclectic as a Picasso. And no list of key themes from 2015 would be complete without acknowledging closely-followed remarks from oilfield services leader Schlumberger opining about tightening oil markets that point to a brighter future ahead for beleaguered energy investors.

Changing of the Guard

Retailing doesn’t typically jump off the front pages of business news this early in reporting season but what came out of the folks from Bentonville, AR earlier this week turned heads. Investors have known for some time the challenges Wal-Mart Stores Inc. faces with Amazon’s web-based retailing model, smaller format dollar stores that have chipped away at its store traffic, and rejuvenated competitors like Kroger that have made life tough on the company that derives 55 percent of its sales from the grocery aisle. That said, few foresaw the bomb that management dropped on investors when it slashed earnings guidance next year by 12 percent amid new forecasts calling for flat sales and a prolonged decline in profits. While the degree of Walmart’s business deterioration is surprising, what isn’t is how investors responded: taking the stock down by 10 percent Wednesday and destroying $22 billion of market capitalization in the process. Investors tempted to bottom fish this one should be forewarned – the workout for Wal-Mart will be neither quick nor painless.

In a related vein, broader retail sales data reported this week was disappointing, declining sequentially even after adjusting for lower priced gasoline.  Notwithstanding the weaker tone of September retail sales, we continue to believe that the consumer is in good shape, benefiting from the aforesaid decline in fuel prices, a healthy job market, and low interest rates.

Banking on Earnings

On the banking front, investors received earnings updates from the money center banks this week and, by and large, the results hewed to our expectations: weak results in trading and capital markets offset by solid single-digit loan growth amid challenged net interest margins. Bank of America and Citigroup stood out to the upside while J.P. Morgan and Goldman Sachs struggled with challenges in fixed income, commodities, and currency trading. The major banks appear to be doing everything they can to reduce discretionary expenditures in the face of ongoing pressure to core net interest income that is being disadvantaged by zero interest-rate policy from the Fed. We remain overweight financials with the expectation that rates will rise, boosting margins and unleashing substantially better levels of profitability.

Our Takeaways from the Week

  • The floodgates of earnings season opened this week, as money center banks and various other blue chip companies reported third quarter results
  • Disappointing retail data and nearly non-existent inflation have investors deferring rate hike expectations into 2016

Disclosures

Upside Down

Ralph-00338_cmykby Ralph Cole, CFAExecutive Vice President of Research

Upside Down

This has been one of the most interesting trading weeks of the year. The seasonal pattern of the stock market is to bottom in October, and rally through the end of the year. While this doesn’t happen every year, so far in October we are following that script. The S&P 500 sold off sharply following the Fed’s decision not to raise interest rates at the September meeting, but found bottom last Friday and has rallied ever since.

Often times the fourth quarter rally is led by names that have performed poorly in the first three quarters of the year. This week was no exception. Through the first nine months of the year energy, materials and the industrial sectors were down 21 percent, 17 percent and 10 percent respectively. Over the last week energy stocks are up 7 percent, the materials sector is up 6.5 percent and industrials are up 6 percent.

Two questions come to mind: First, why did this happen? Secondly, is it sustainable?

Growth stocks were in favor for the first nine months of the year. This is typical during periods of slow global growth as investors are willing to pay handsomely to get the kind of sales growth we have seen in Netflix, Amazon and the healthcare sector. At some point, these names become very expensive. The global slowdown has been led by China, and this past week economic data has been a little better in that country. Probably not enough to signal a huge change in their economy, but enough to spook investors regarding short positions in the more cyclical parts of the market.

As a firm, we believed that oil prices and the energy sector were due to rally because of supply and demand responses in the energy markets. Specifically, low oil prices have caused gasoline demand to rise here in the U.S., while simultaneously causing a drop off in oil production. Historically this combination has always led to higher oil prices and oil rallied nearly 10 percent this week alone.

Whether or not this change in the trend is sustainable remains to be seen. The developed economies of the world remain the engines of growth of the global economy. Demand from the U.S., UK and Europe need to rescue growth in flagging emerging market economies. We believe that this will be the case in the coming months, but doubt that the market will continue its recovery in a straight line. Slow growth accompanied by Fed uncertainty will lead to continued heightened volatility.

Our Takeaways for the Week

  • Fourth quarter rallies are common in the stock market, and so far this quarter we are up nearly 5 percent
  • We think global growth will accelerate as we move into 2015, supporting the more cyclical sectors of the S&P 500

Disclosures

To Beat or Not to Beat .... Expectations

by Brad Houle, CFA Executive Vice President

Today the Federal Reserve released the September change in nonfarm payrolls which came in at 142,000 jobs versus the estimate of 201,000 jobs. Also, August data was revised down from the originally reported 173,000 jobs to 136,000 jobs. This data was seen a disappointment and the bond market reacted negatively. According to Bloomberg data, the Federal Funds Futures Market, which is a market in which traders can speculate on the direction of the Federal Reserve raising interest rates, shows only a 2 percent probability of the Fed raising interest rates this month. The probability of the Fed to raise interest rates in December has dropped from a 40 percent probability early this month to a 29 percent probability as of today.

It is important to remember that the U.S. has created an average of 200,000 jobs for the last six months. Since the depth of the financial crisis, the unemployment rate has gone from over 10 percent to around 5 percent where it is today. We prefer to take the long view as opposed to changing opinion on every incremental piece of economic data. Payroll data is notoriously volatile and is a backward-looking indicator. U.S. consumer spending accounts for nearly 70 percent of our GDP or national income and continues to be robust despite a couple of months of job creation that does not meet expectations.

One of our research partners, Cornerstone Macro, published a note this morning with some facts about the U.S. consumer that are worth sharing:

  • Consumer income growth has been a solid 4 percent for the past five years
  • Real income expectations are rising for the first time in 20 years
  • Consumer confidence is trending higher across all income levels
  • Small businesses are having a hard time filling jobs
  • Increasing construction spending is a major support to construction employment
  • Increasing manufacturing construction is a support for manufacturing employment
  • Average hourly earnings is in a rising trend for finance, business services, construction, health and education
  • Auto sales came in at a seasonally adjusted annual rate of 18.2 million units, the most in more than 10 years

We still believe that the domestic economy and the U.S labor market are continuing to heal from the Great Recession. The headwinds from emerging market turbulence and a strong dollar are not large enough to derail this economic expansion.

 Our Takeaways from the Week

  • Job creation for September and the negative revisions for August did not meet economists’ expectations; however, the equity markets largely ignored the data finishing up modestly for the day
  • The bond market reacted more with the 10-year Treasury bonds finishing the day below 2 percent

Disclosures

Flying High Again

by Jason Norris, CFAExecutive Vice President of Research

Flying High Again

Earlier this week Democratic presidential candidate Hillary Clinton announced several healthcare proposals. The focus was to propose policies that aim to keep the price of drugs down. This was on the heels of a specialty drug price for AIDS being raised over 5000 percent from $13.50/tablet to $750 that has since been reduced. However, these proposals highlight the concerns over drug pricing, specifically specialty pharma drugs.

Clinton’s plan would attempt to cap the prices paid for Medicare recipients, increasing drug re-importation, reducing the patent exclusivity for biologics and getting rid of the tax deduction for advertising spending. Although many of these proposals have been presented in some form in the past, headlines were not friendly to the healthcare sector. Since disclosing her proposals, the pharma and biotech industries have fallen over 3 percent. Names that have high priced biologics, such as Gilead Science for Hepatitis C, fell even more. Despite viewing this as an overreaction for a variety of reasons, due to the headline risk, we are not in a big hurry to put new money back to work in the sector.

While drug costs are rising and patients are becoming more frustrated with this phenomenon, out-of-pocket costs are at historic lows for consumers. Drug payments are increasingly being paid out by the insurers (see charts).

Graphs

Even if Clinton is elected president, expectations are for the House to remain to the right, thus making it very difficult for any of her proposals to be enacted. The Republicans may be willing to negotiate something on drug pricing but it will probably have to come with broader entitlement reform. Right now it is too early to tell but headlines may reign as we move into the election season.

While insurance providers are paying an ever increasing amount of drug costs they continue to be active in minimizing this expense and are increasingly considering the total cost of treatment. I was able to meet with a handful of insurance companies over the last week and discuss their focus on the total cost of care and preventative medicine. If a drug is very expensive and it can cure a disease that was previously just maintained, they will be inclined to pay for it (i.e., Hep C). Also, they are increasing their focus on compliance and general health with the belief that this will decrease healthcare costs over the life of the patient. The monitoring of vital statistics (blood pressure, cholesterol, weight, etc.) should lead to lower longer-term health spending.

We still believe the healthcare sector offers some great opportunities but headlines will keep volatility elevated.

Our Takeaways for the Week

  • Drug pricing headlines will continue to add volatility to the sector
  • Health insurers are increasingly focusing on the total cost of treatment to manage costs

Disclosures