

by Joe Herrle, CFA
Vice President
Alternative Assets and Portfolio Management
The chatter is unmistakable. From trading floors to investment committee meetings, "bubble" has officially entered the market dialogue. The latest Schwab survey reveals that 57% of professional traders now view the market as overvalued. Meanwhile, prominent economists are drawing comparisons to the dot-com era, with Apollo Global Management's chief economist Torsten Slok noting that today's top stocks are "more overvalued" than their counterparts were in the 1990s. Yet, despite this growing chorus of concern, history suggests today’s AI bubble may be something closer to what occurred in 1996 than the IT bubble of 1999 – and that distinction matters enormously for what lies ahead.
The Hallmarks of a True Bubble
For context, it's worth establishing what constitutes a genuine market bubble. True bubbles share several characteristics: extreme valuations divorced from fundamentals, rampant speculation by retail investors, companies going public with no profits or viable business models and, lastly, widespread euphoria where caution is abandoned. Most importantly, the “widespread euphoria” of a bubble means broad participation – not just institutional money, but a frenzy of individual investors convinced they've found a path to easy riches.
Today's market, while expensive by historical standards, doesn't yet exhibit these extremes. The S&P 500 Shiller Cyclically Adjusted Price-Earnings (CAPE) ratio, an indicator of market valuation, remains at 39.6, the highest since October 2000. However, current tech leaders, such as Microsoft, Google and Nvidia, are generating substantial profits and cash flows. Unlike the dot-com era, when companies with no revenue commanded billion-dollar valuations, today's AI leaders are backed by genuine earnings power.
The Scale of Current Gains vs. Bubble Extremes
Perhaps the most telling comparison lies in the magnitude of stock movements. During the dot-com frenzy, market leaders posted astronomical gains that dwarf today's advances. Cisco Systems, the poster child of that era, surged 130% in 1999 alone. By contrast, even this year's AI darlings have posted far more modest gains, suggesting markets have further room to run.
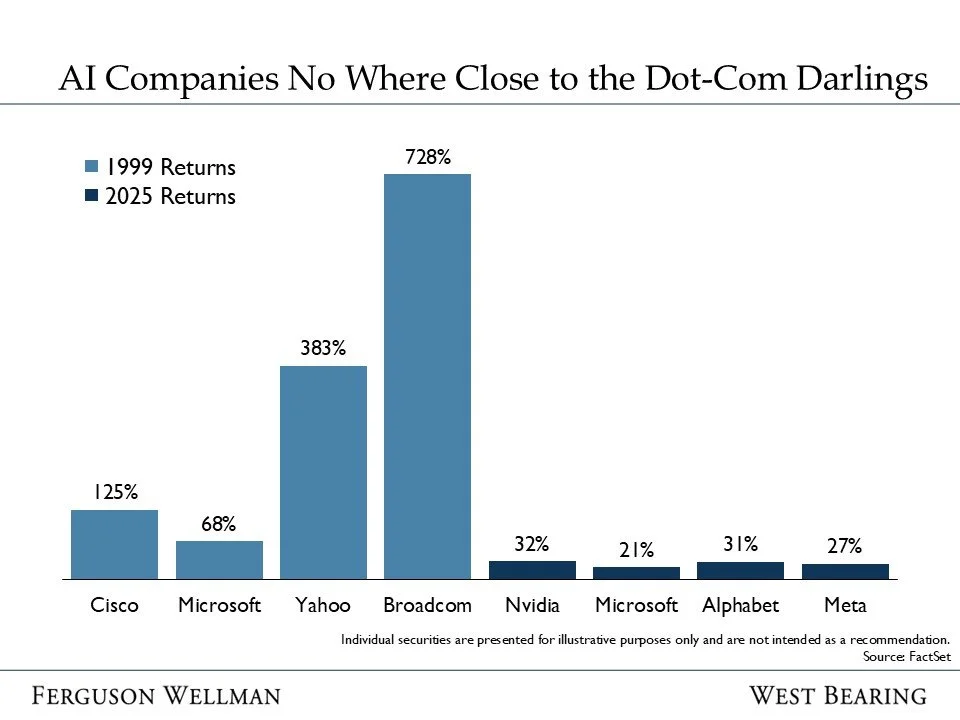
Source: FactSet
This restrained performance suggests we haven't reached the speculative fever pitch that characterized previous bubbles. When Nvidia, today's AI champion, posts gains that pale in comparison to those of dot-com era leaders, it signals a market that, while optimistic, hasn't yet lost its moorings.
AI Adoption: More 1996 Than 1999
The most compelling argument against bubble territory lies in AI adoption rates. Current data from Evercore ISI shows only about 25% penetration across all business functions in corporate America, placing us squarely in the early adoption phase – analogous to the internet in 1996, not the speculative peak of 1999.
Consider the parallels: In 1995, the internet was commercialized, but most businesses were still figuring out how to use it. Similarly, while 78% of organizations now use AI in at least one function, the vast majority are still in the exploratory phases. As noted in a recent Wolters Kluwer survey, 86% of finance teams are "beginning to explore AI use cases" rather than deploying it at scale, and only 22% have a visible, defined AI strategy. However, 92% of companies plan to increase their investment in AI over the next three years.
This early-stage adoption suggests substantial runway remains for both technology development and market appreciation.
Greenspan's Lesson: Timing the Peak is Nearly Impossible
History's most famous bubble warning offers a sobering lesson about market timing. On December 5, 1996, Federal Reserve Chairman Alan Greenspan delivered his iconic "irrational exuberance" speech, questioning whether asset values had become "unduly escalated." Markets initially swooned but then embarked on one of the greatest bull runs in history.
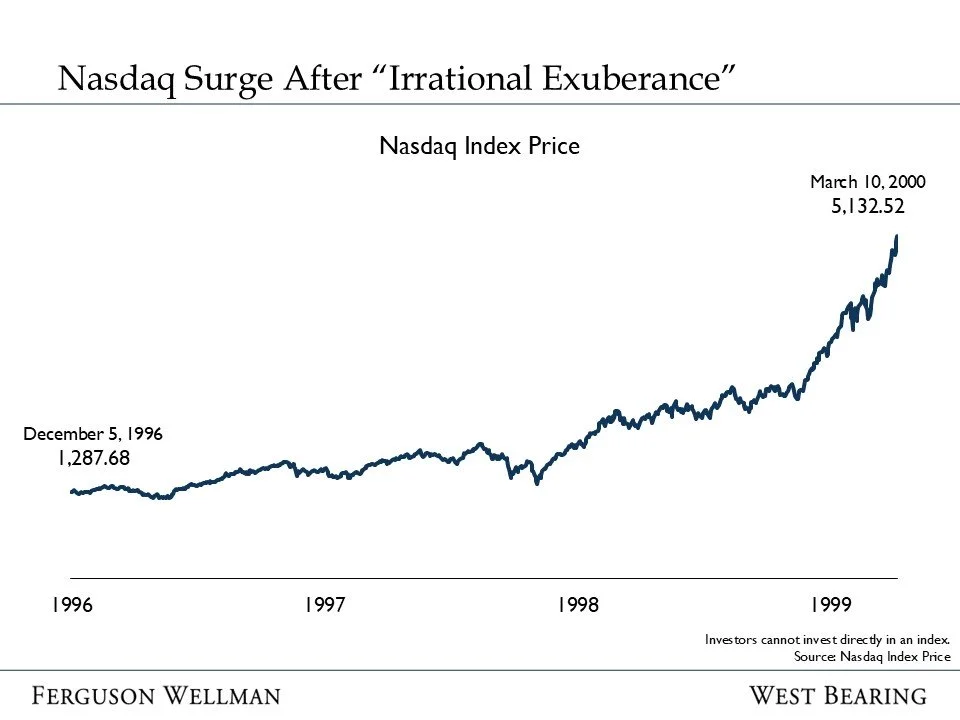
Source: Nasdaq Index Price
The Nasdaq didn't peak until March 2000 – over three years later – after gaining almost 300% since Greenspan's warning. In this period, Nasdaq’s annualized average return was a colossal 52%. This massive run-up occurred despite clear warnings of a bubble from one of the world's most respected economic voices. The lesson? Even accurate diagnoses of market excess can be dramatically early.
Volatility: The Price of Admission
One aspect that remains consistent between bubble and non-bubble markets is volatility. Those expecting a smooth ride to higher prices will be disappointed. Even during the dot-com bull market, the Nasdaq experienced numerous corrections exceeding 10%.
Current market data confirms that this pattern continues. The S&P 500 has already experienced an 8-9% pullback in 2025, and additional corrections should be expected. As historical data shows, 10% declines occur roughly every 1.5 years, while 15% pullbacks happen about every 2.5 years. This volatility doesn't signal an impending crash – it represents the normal ebb and flow of bull markets.
The Path Forward
While bubble discussions have entered mainstream market dialogue, several factors suggest this expansion has further to run. AI adoption remains in its early stages, with current stock gains being modest compared to bubble extremes and leading companies continue to maintain strong fundamental performance.
However, investors should expect continued volatility along the way. The dot-com bull market experienced multiple sharp corrections that tested investor resolve. Similarly, today's AI-driven expansion is likely to face periodic setbacks as markets absorb new information and adjust valuations.
The key insight from Greenspan's experience is that markets can remain "irrationally exuberant" far longer than seems reasonable. For investors positioned appropriately, this suggests the current expansion may have more chapters to write before reaching its conclusion.
Takeaways for the Week
Core Personal Consumption Expenditures (CPE) inflation stayed at 2.9% for August, meeting expectations but remaining above the Federal Reserve’s target, which has led markets to scale back the odds of more aggressive rate cuts for the remainder of 2025
U.S. stock indices set fresh all-time highs early in the week, but then pulled back as investors weighed shifting monetary policy expectations and renewed volatility in leading tech and AI stocks