

by Jason Norris, CFA
Director
Equity Research and Portfolio Management
The 152nd Kentucky Derby is being run this Saturday, and earnings reports are coming in like Secretariat in 1973. Roughly 60% of the S&P 500 companies have reported to date and results so far have been strong. Expectations for first quarter earnings growth was 13%, and those expectations have risen to 25%, with a revenue growth of 10%. Additionally, over 80% of companies have delivered positive surprises. Tech stocks have been a major standout delivering growth at just under 50% year-over-year for the quarter, which, if this rate were to continue, could result in 40%+ growth for the full year, close to double the expectation from the beginning of the year. Earnings growth for the S&P 500 for 2026 have now hit 20%. Thus, even with stocks up 5% YTD, the S&P 500 is cheaper than it was at the beginning of the year. The Price-to-Earnings ratio in January was 22x earnings, and today it is 21x. While this valuation is above the long-term average, we believe that the market’s growth and profitability can likely justify these levels for an extended period of time.
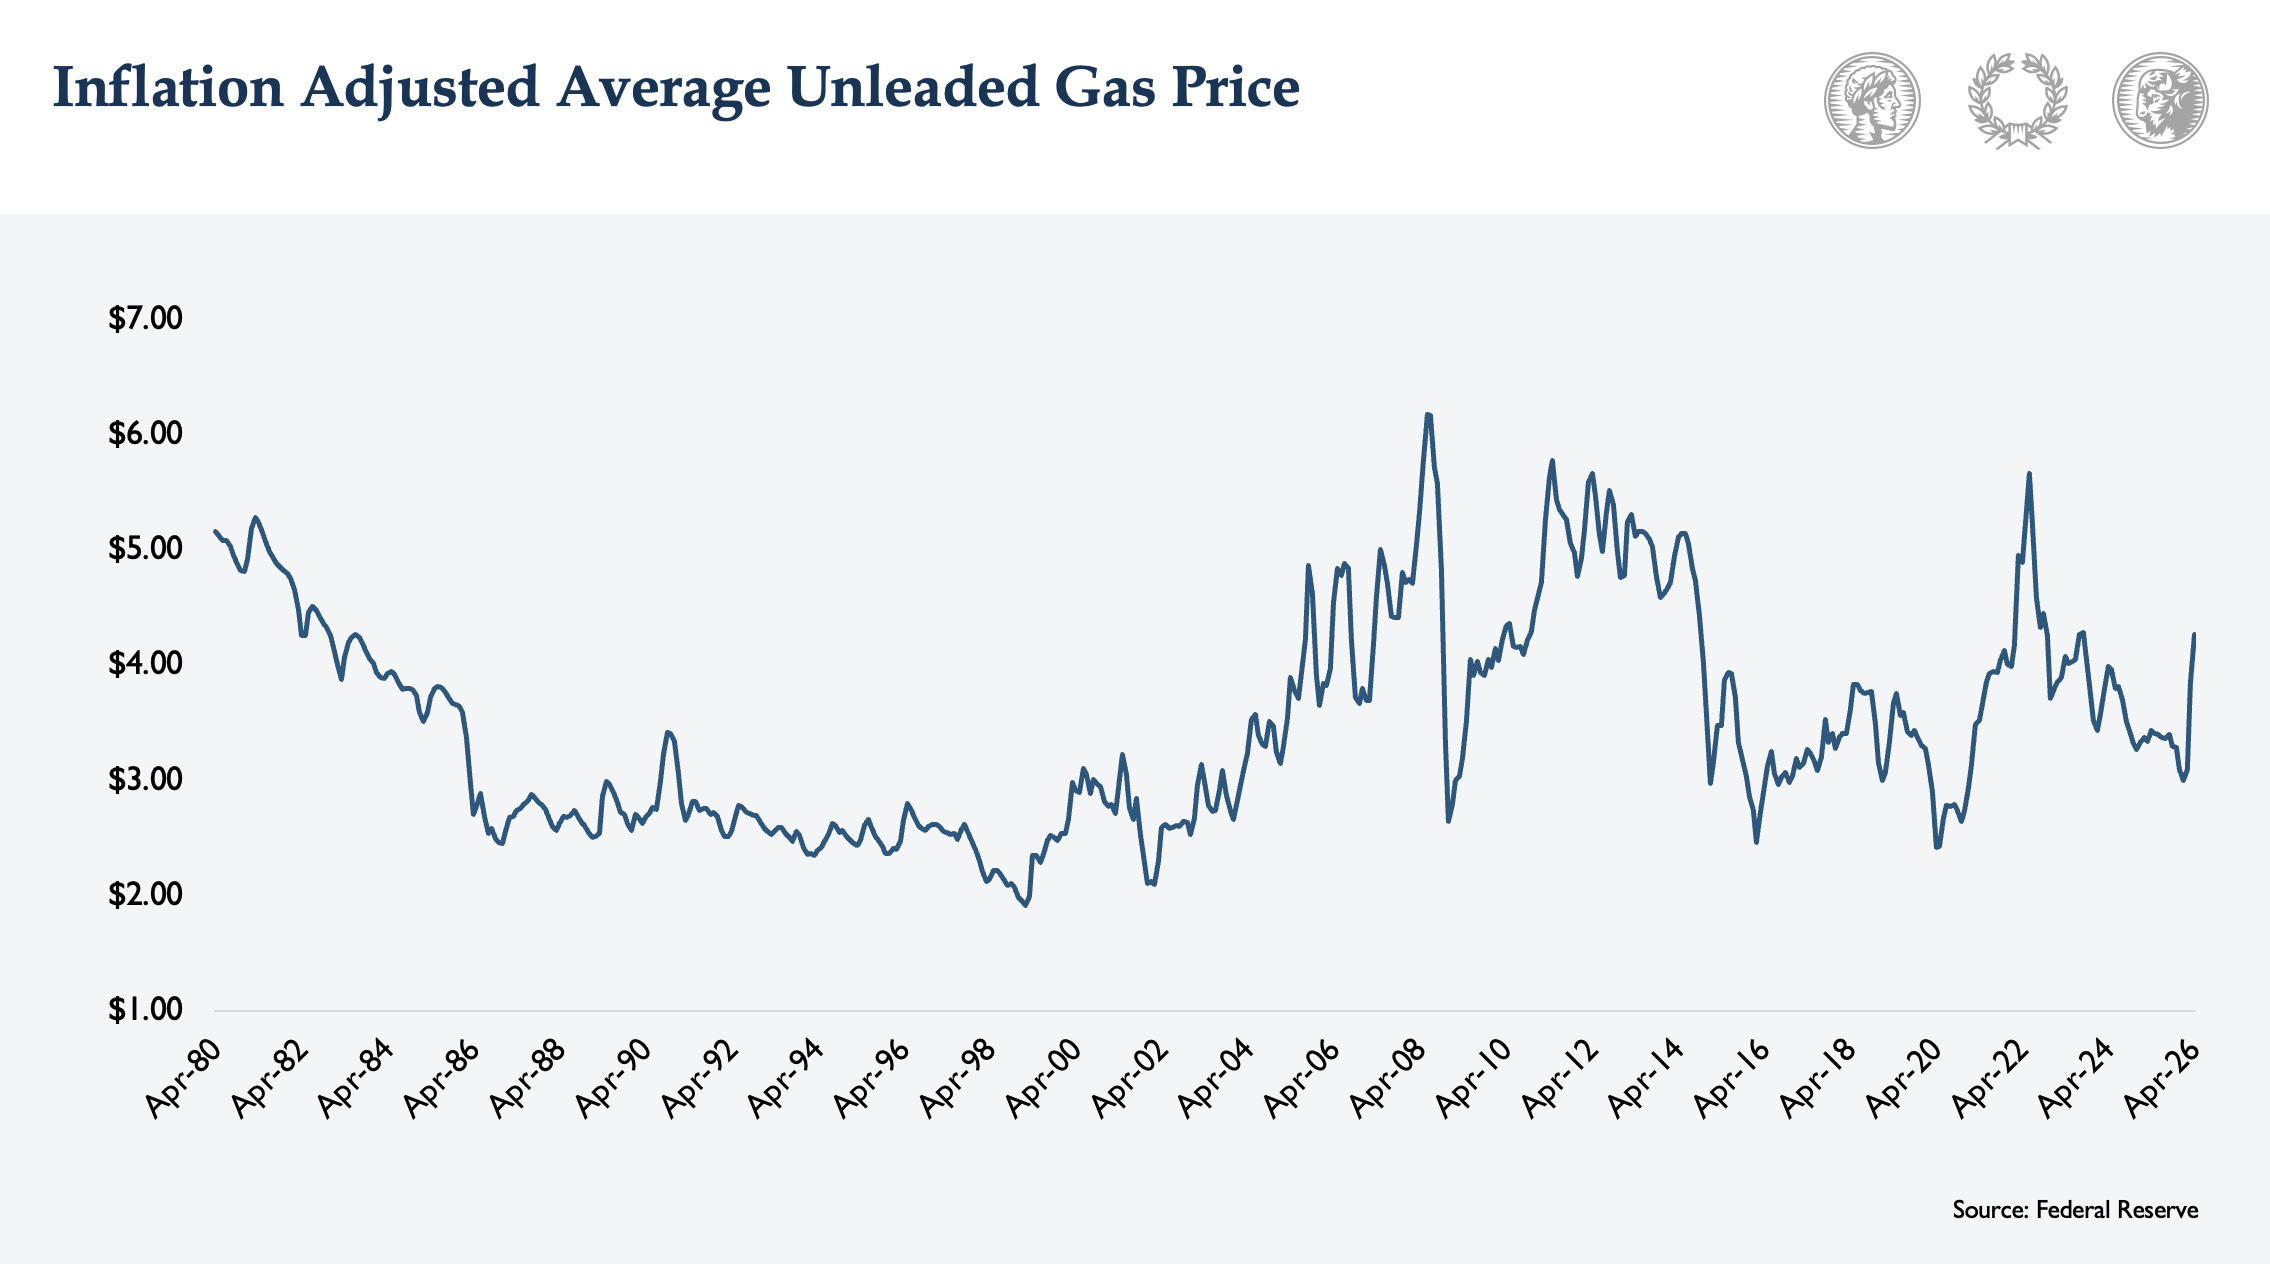
Earnings reports from banks as well as credit card companies have all signaled that the consumer is still in good shape. But, with gas prices now above $4/gallon, the question is:: when does $4+ for a gallon of gas start having a broad impact on the consumer? Looking at the last four decades, we’ve seen gas prices at elevated levels multiple times. While it’s rare to see the national average above $4.00/gallon, there have been extended periods where prices were greater than $3.00. However, we can’t just look at the absolute price, it’s also important to adjust it for income growth or inflation. The price of gas in 1980 was $1.25, that same gallon of gas in today’s dollars is ~$5, versus today’s price of $4.35. The chart below adjusts the price of gas to inflation, and as you can see, the current price is in the middle of the range over the last 20 years. Income growth post Covid, as well as tax cuts, have largely allowed consumers to “weather” the storm; at least for the time being.
If you are lucky enough to attend the Kentucky Derby and enjoy a mint julep, you’d pay over $22, in 1980 it was $3. Mint julep inflation is running twice that of the overall rate.
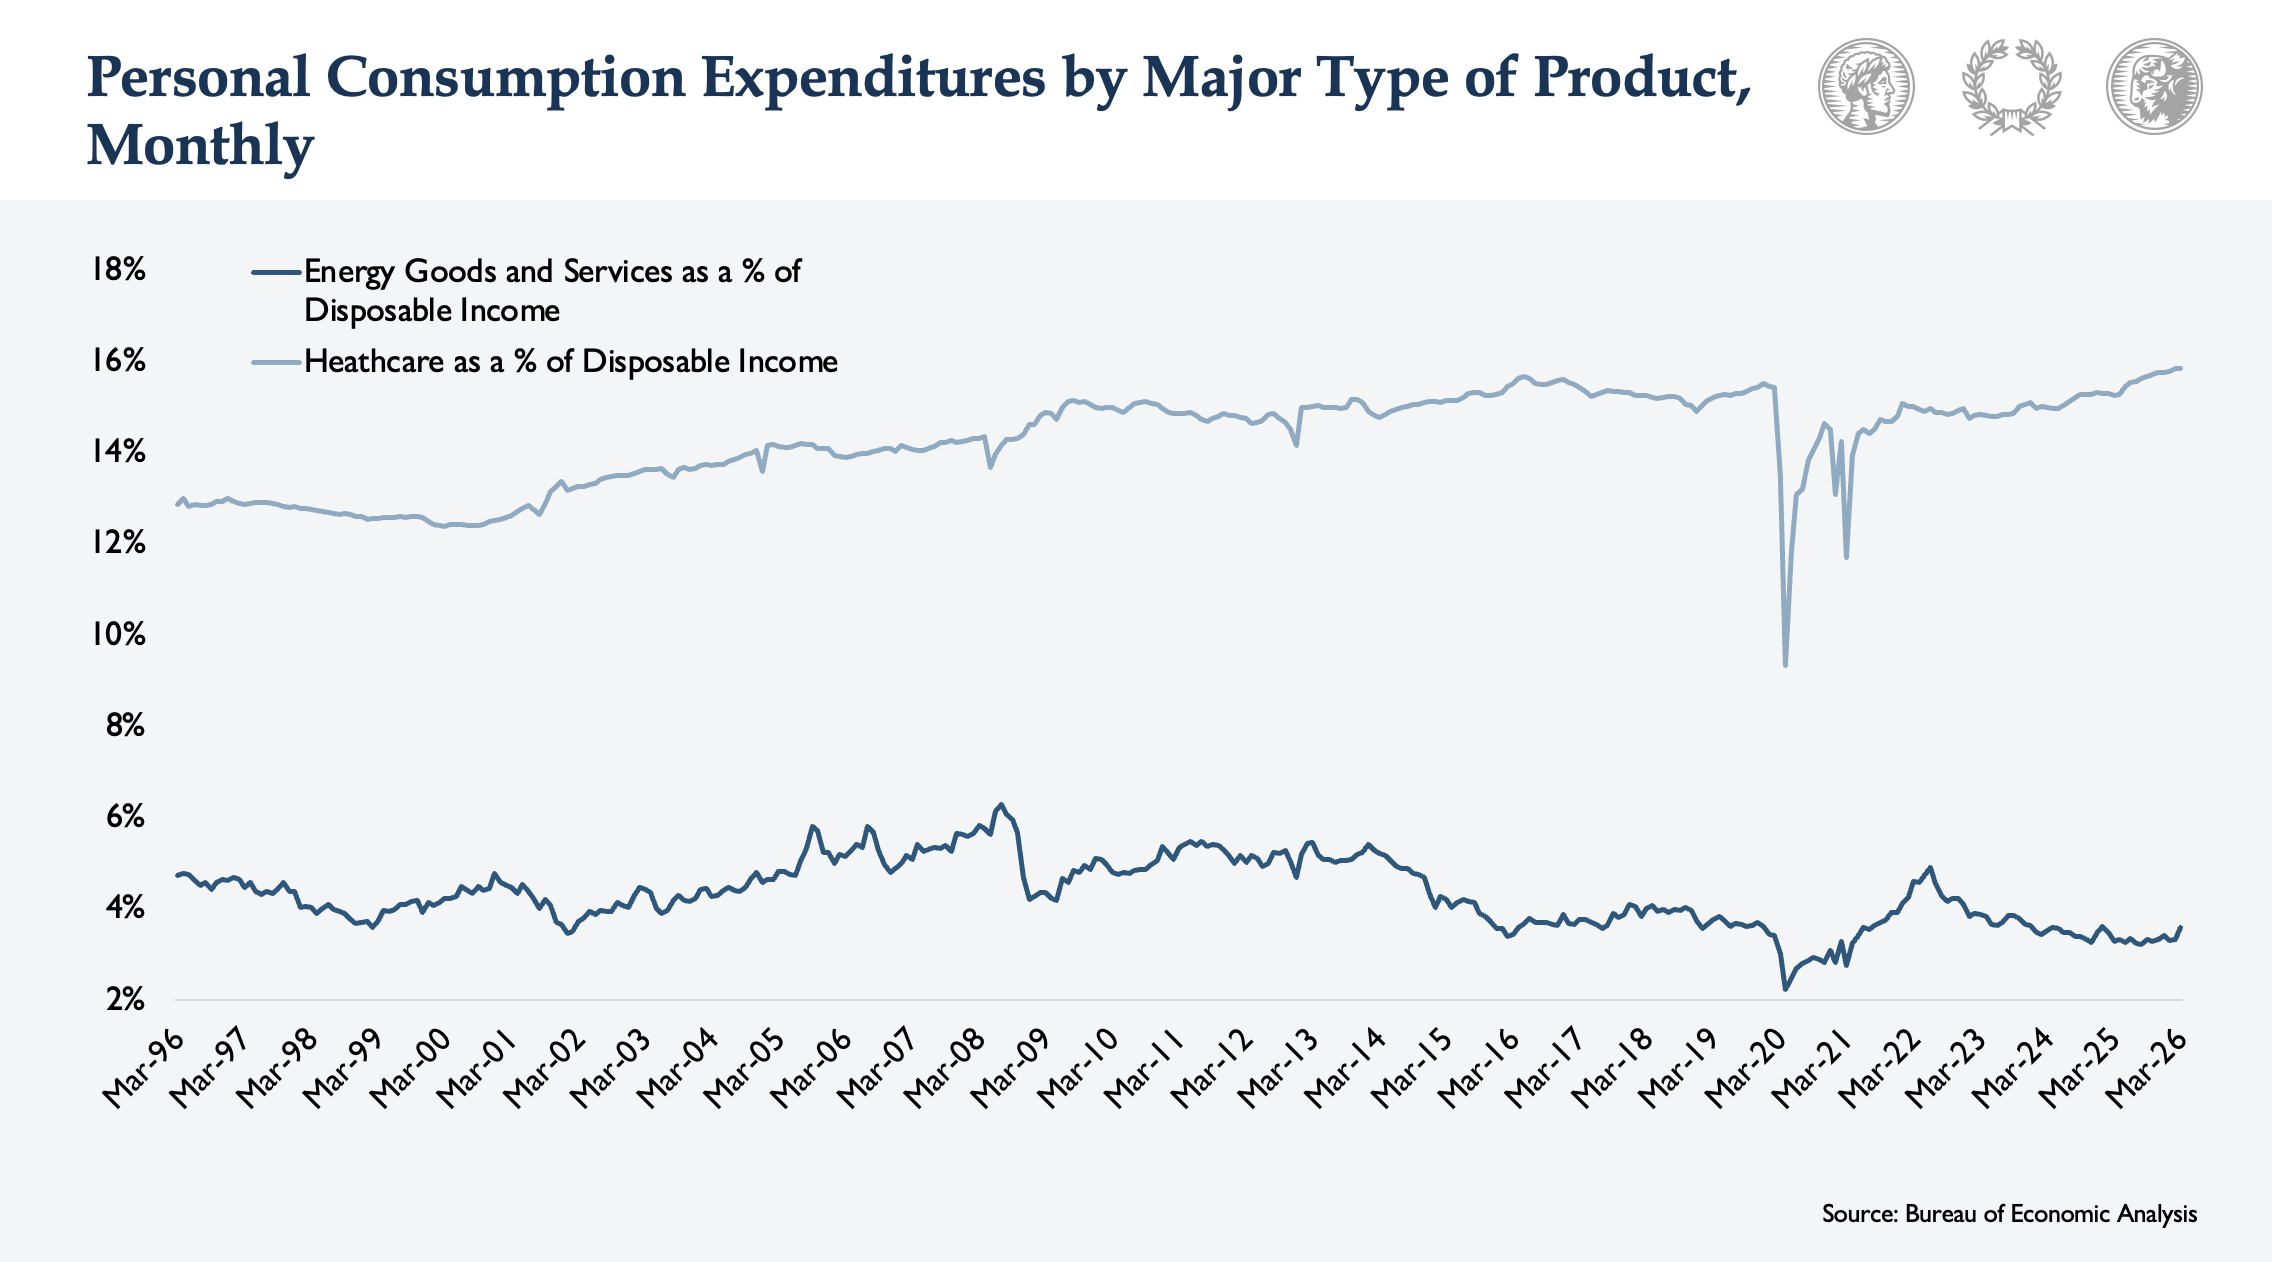
Putting overall energy spending into, consumers spend under 5% of their income of energy, and historically, gas is 35-50% of this number. Over the last thirty years, healthcare spend has grown from 13% of spending to 16% (see chart below), which has an annualized growth rate of just under 6%, while energy spend grew under 4% annually.
Takeaways for the Week
Concerns of high energy prices pushed up interest rates at the yield on the 10-Year treasury sat just shy of 4.4%
Earnings powered equities higher pushing the S&P up 1% for the week
Fed Chair Powell held his last press conference as Chair, indicating that the Fed funds rate will remain at current levels for the foreseeable future
Disclosure: The views expressed represent the opinion of Ferguson Wellman. The views are subject to change and are not intended as a forecast or guarantee of future results. This material is for informational purposes only. It does not constitute investment advice and is not intended as an endorsement of any specific investment. Statements of future expectations, estimates, projections and other forward-looking statements are based on available information and Ferguson Wellman’s views as of the time of these statements. Past performance may not be indicative of future results. Ferguson Wellman, Octavia Group and West Bearing do not provide tax, legal, insurance or medical advice. This material has been prepared for general educational purposes only and not as a substitute for qualified counsel who can determine how this information applies to you. We believe the information provided is from reliable sources but should not be assumed accurate or complete.
Please see additional disclosures.