

by Jason Norris, CFA
Director
Equity Research and Portfolio Management
Mark Twain allegedly coined the phrase, “History doesn’t repeat itself, but it often rhymes.” No doubt, the Middle East military escalation this past week rhymed with our history in the region. Previous conflicts of this nature have added volatility to markets without a long-term U.S. economic impact. However, monitoring the price of oil is a key factor for our economic and portfolio outlook this year. Such moments validate our ongoing belief in a broad, diversified portfolio for clients.
Over the last few days, the transition toward a more protracted conflict between the U.S., Israel and Iran has prompted a significant repricing of risk. While Iran’s conventional military capacity is being degraded, its decentralized “mosaic” command structure allows for persistent, asymmetric drone strikes against Gulf energy infrastructure.
While Iran has not technically closed the Strait of Hormuz, the threat of asymmetric strikes against this chokepoint—which handles 21% of global petroleum and 20% of liquified natural gas (LNG) trade—maintains a persistent “fear premium” in energy markets. Other routes via pipeline across Oman or Saudi Arabia are both much more costly and have exposure to attacks.
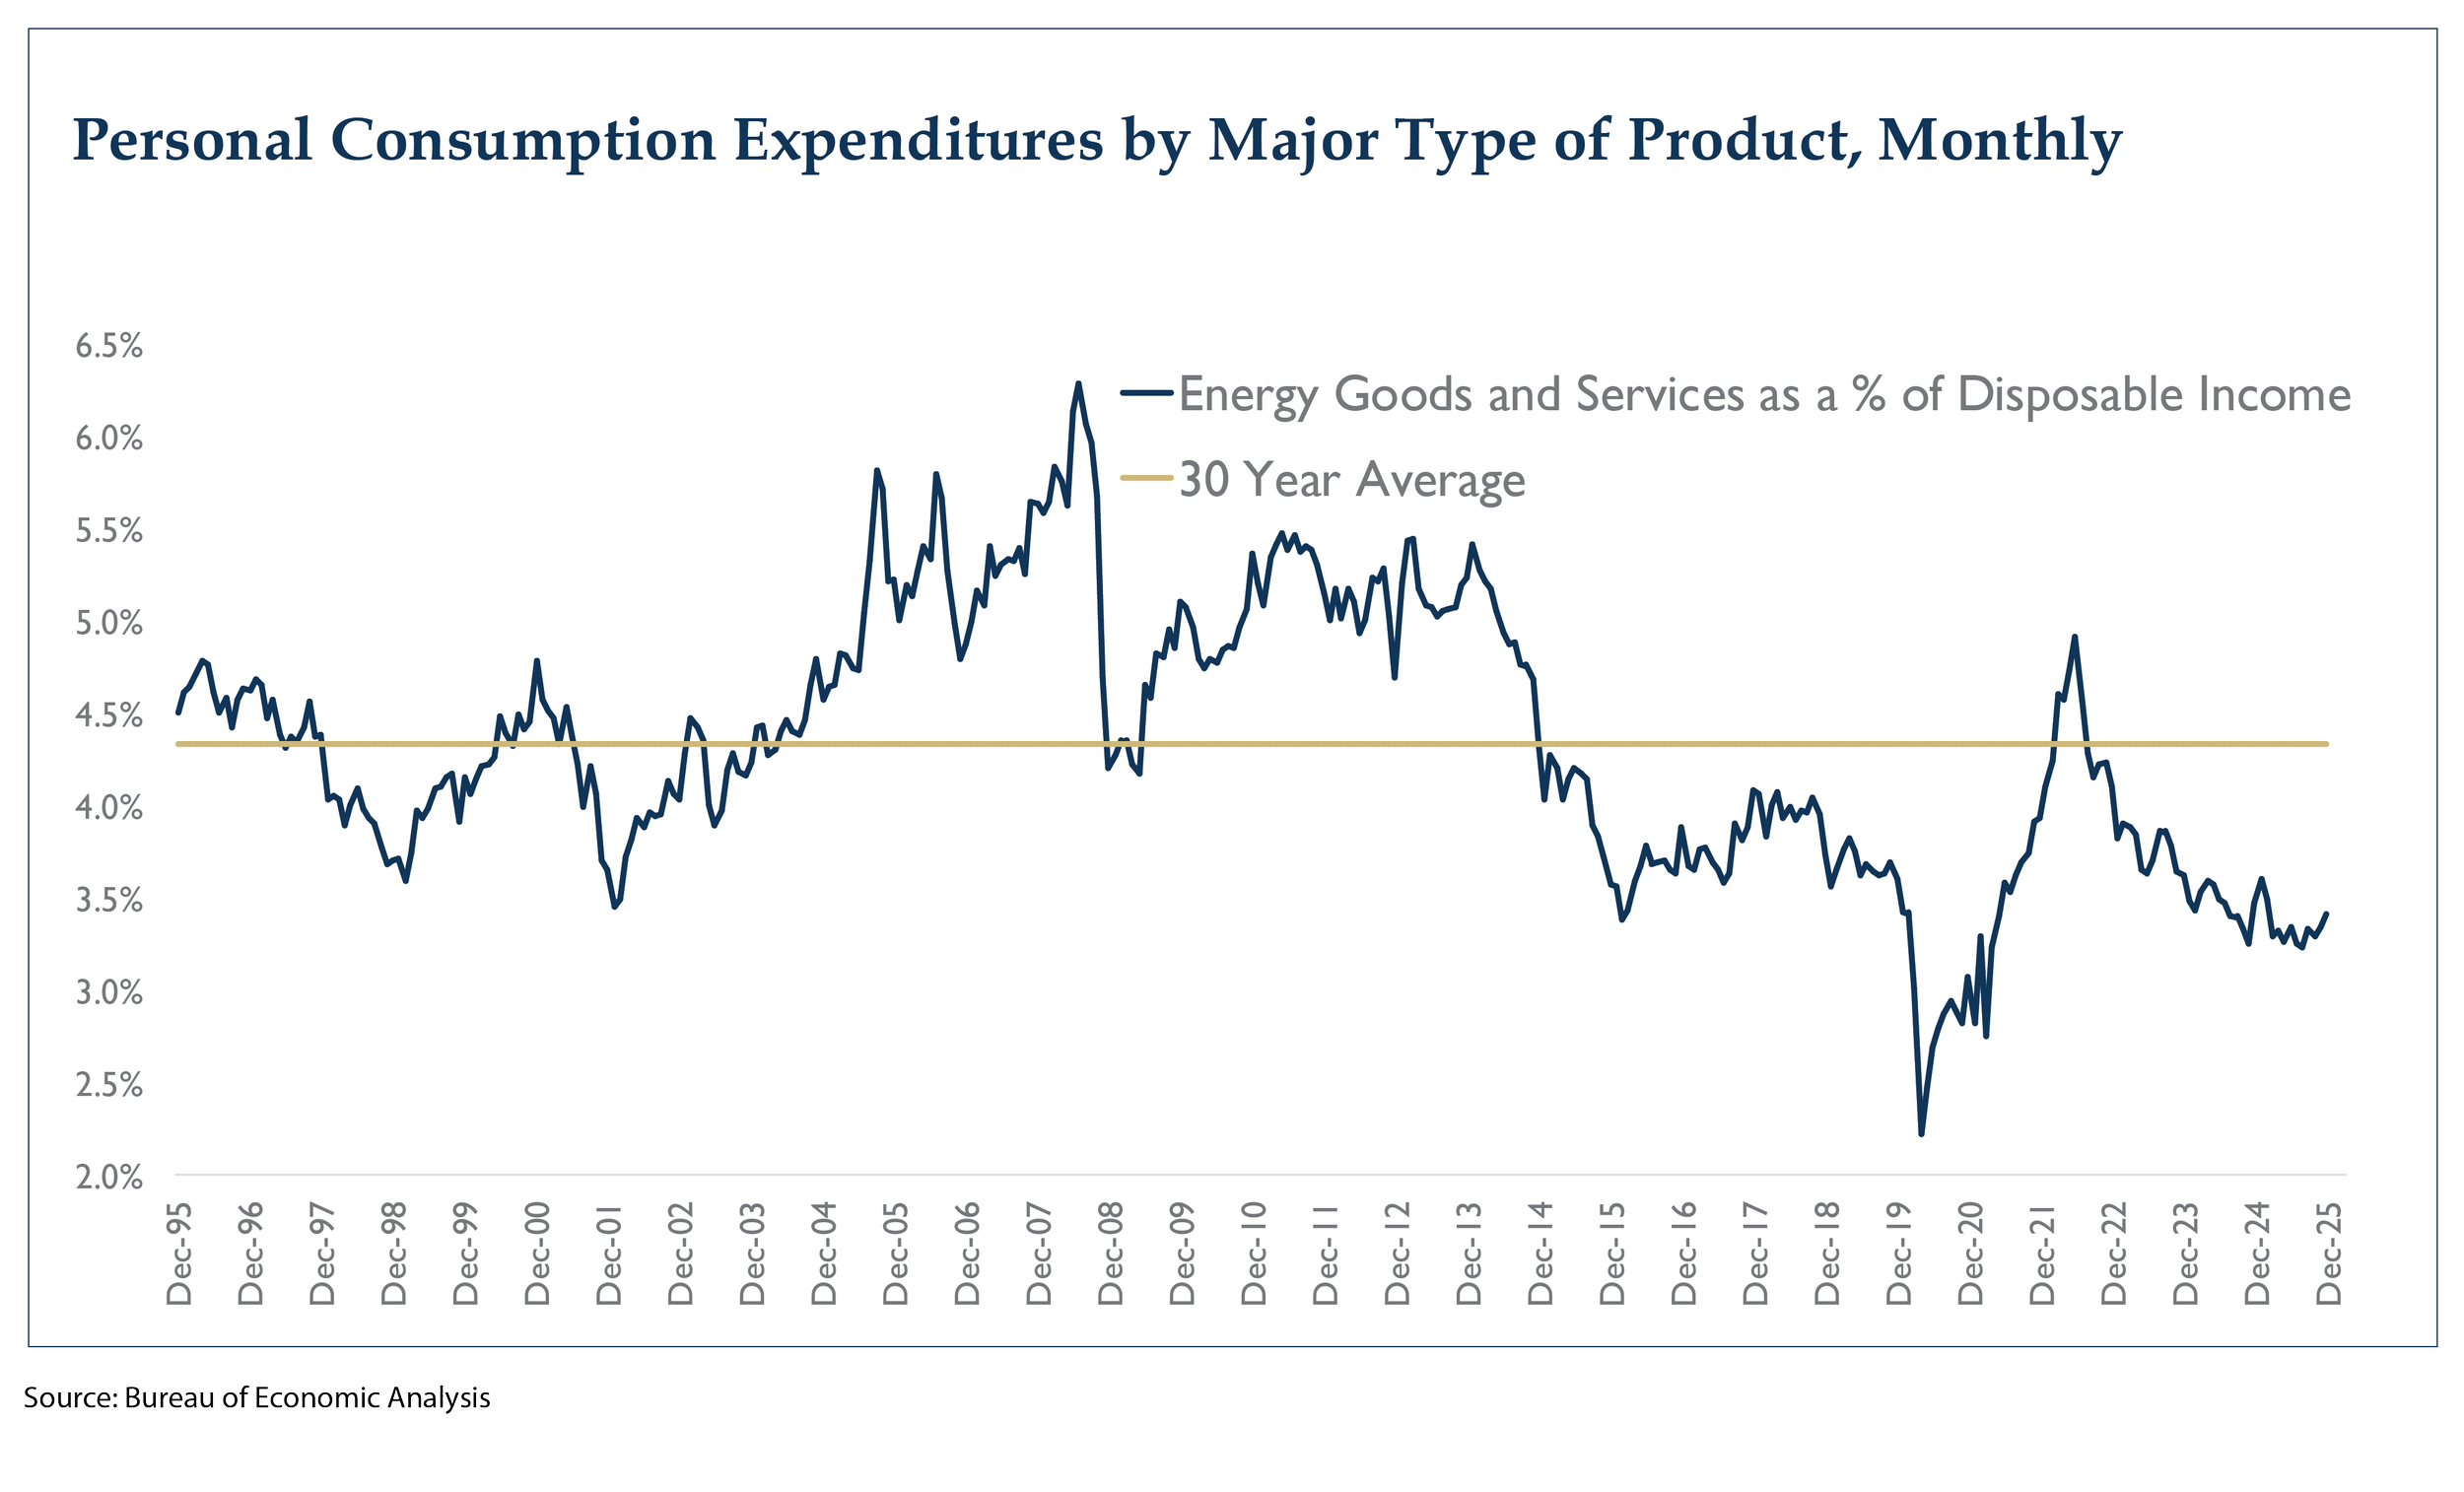
Energy analysts believe the current oil price is assuming the conflict lasts another three-to-four weeks and then the Strait opens. Thus, if the war continues to drag on over a month, inflation pressures and slower economic growth are at a higher risk. While consumers currently spend just over 3% of their disposable income on energy, as seen in the chart below, higher energy prices have more of an impact on those with lower discretionary incomes.
A sustained $20 increase in oil prices is estimated to add $0.50 to the price of unleaded gas and 0.6%–0.8% U.S. headline PCE inflation. While the impact on core inflation may be minimal, this provides the Federal Reserve with a clear rationale to delay rate cuts until September or beyond.
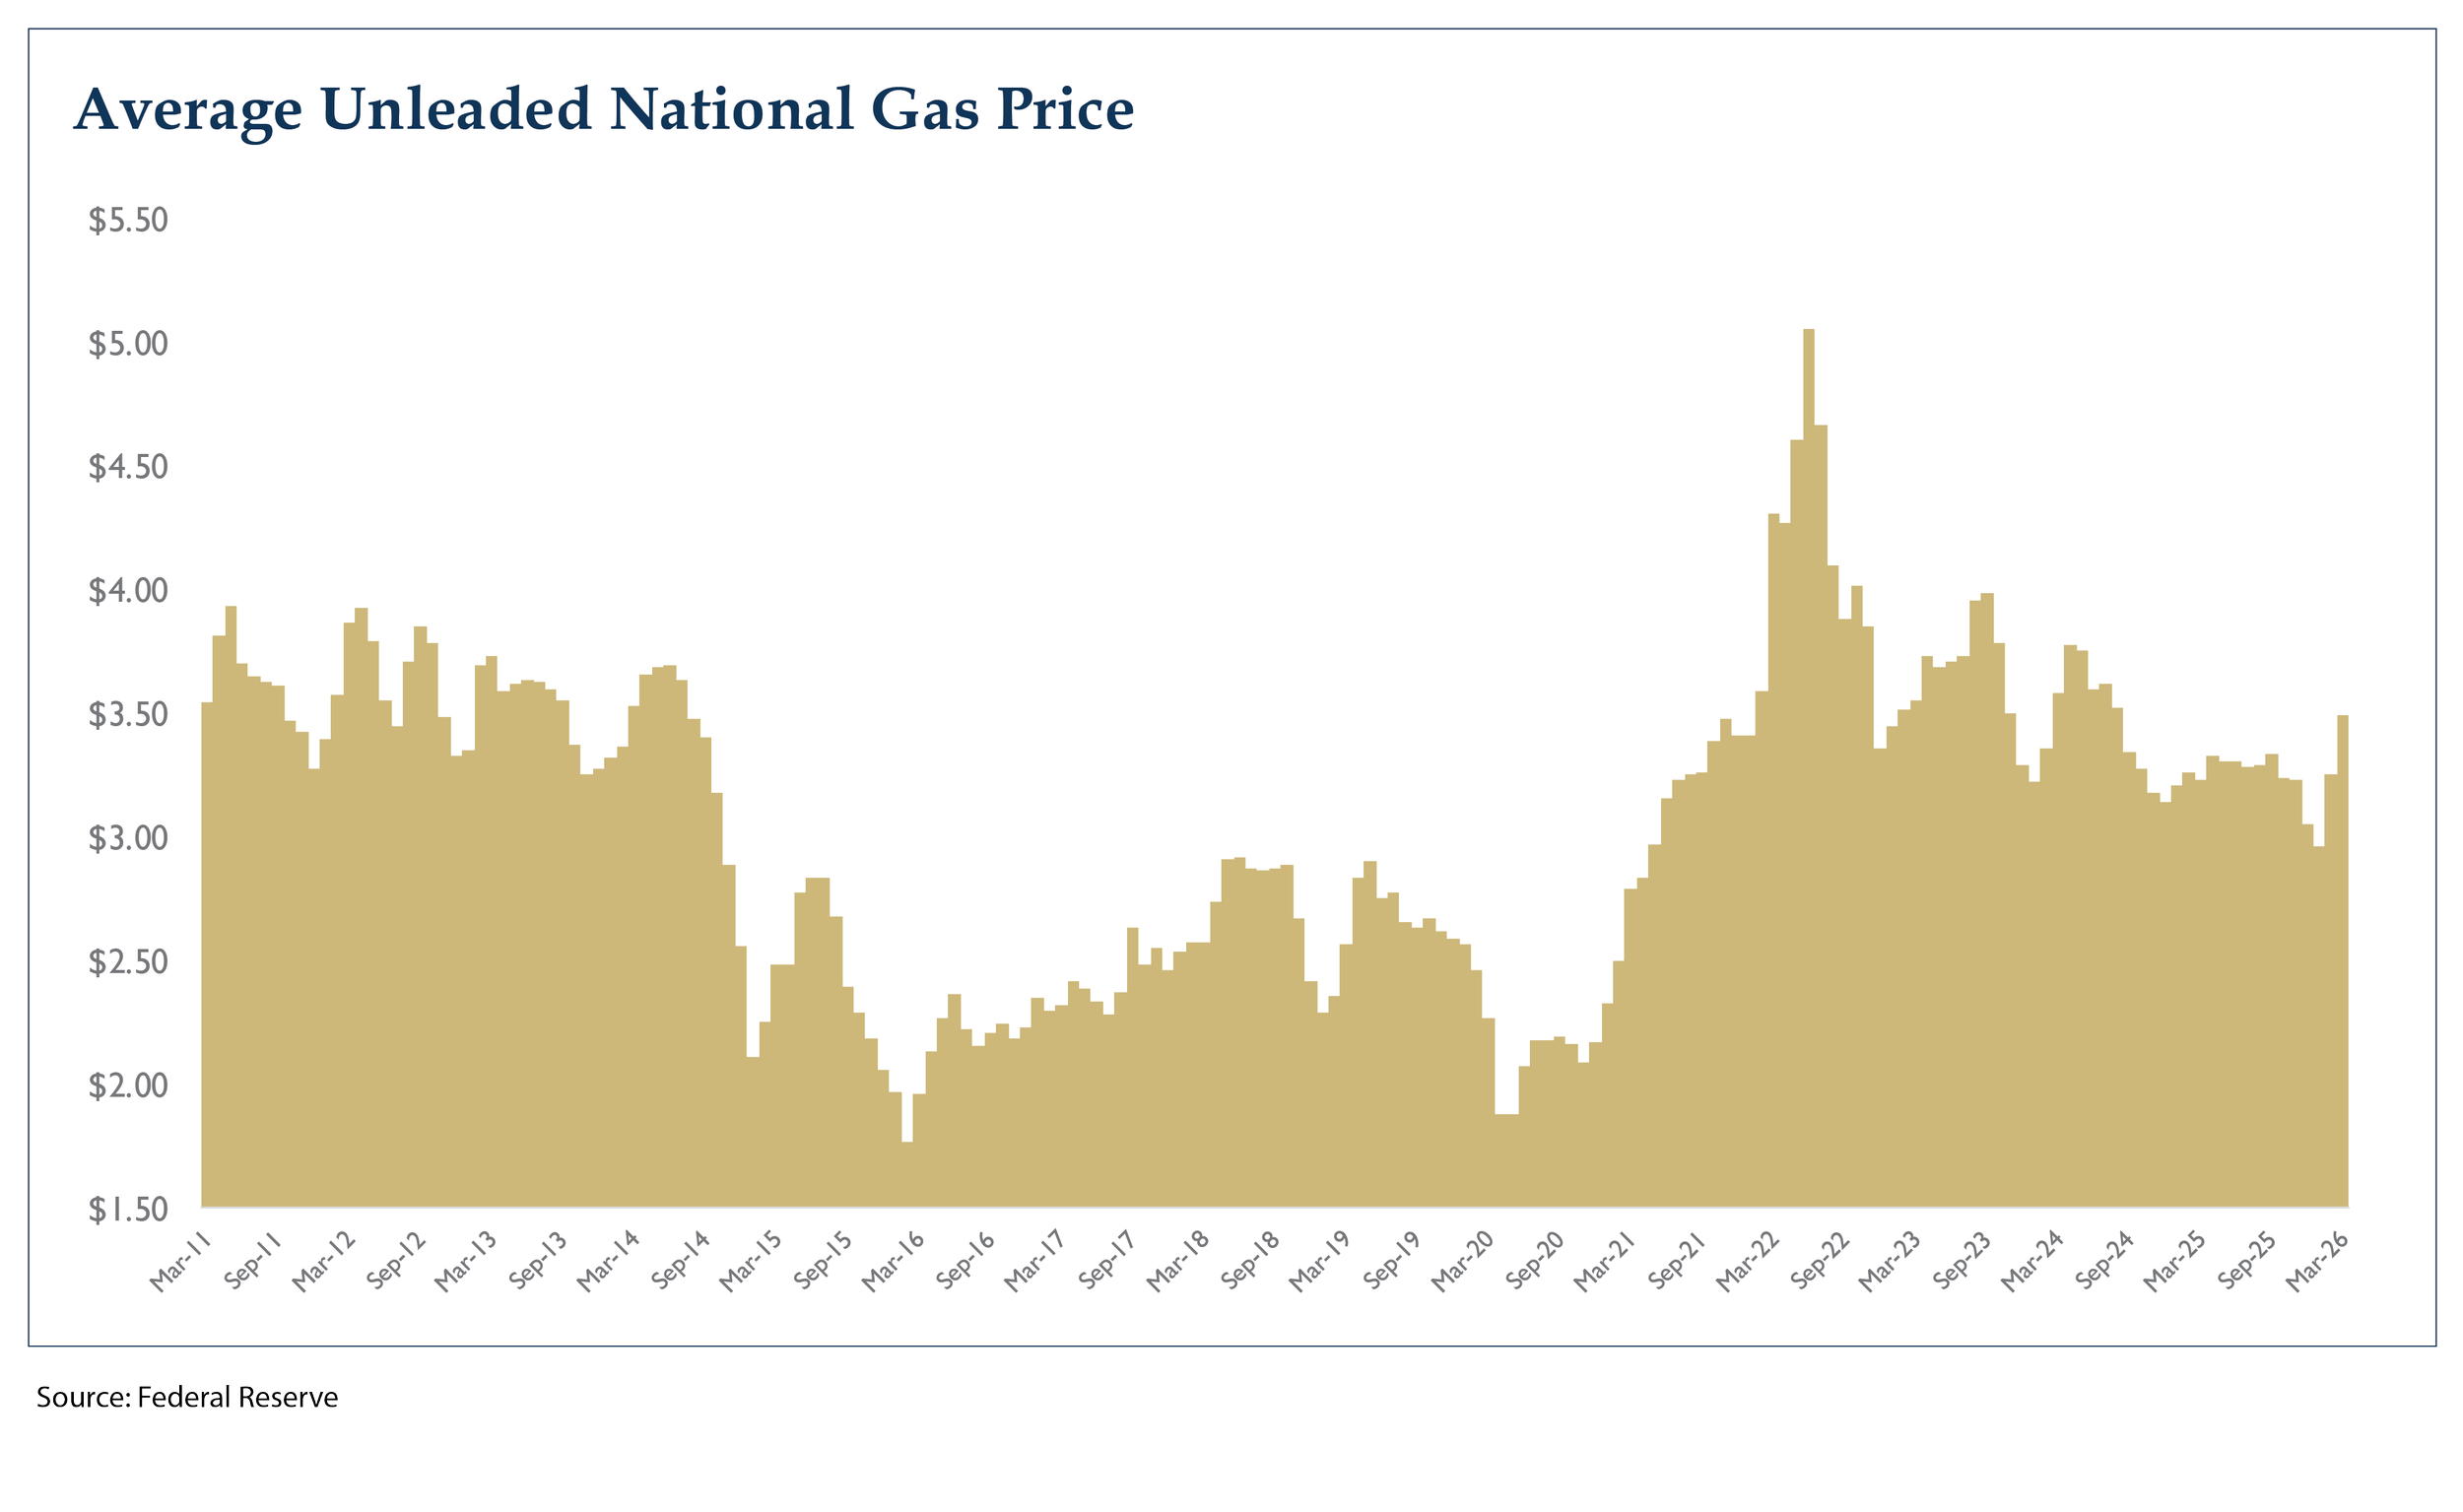
More importantly, the price that consumers see and feel every day is gas. A spike here is likely to impact both discretionary spending, as well as sentiment. The chart below shows the U.S. average for unleaded gas. While we’ve seen a spike, we are still at levels from 18-to-24 months ago. Risk typically escalates for the U.S. economy when prices eclipse the $4.00 level.
Low Hire, Low Fire
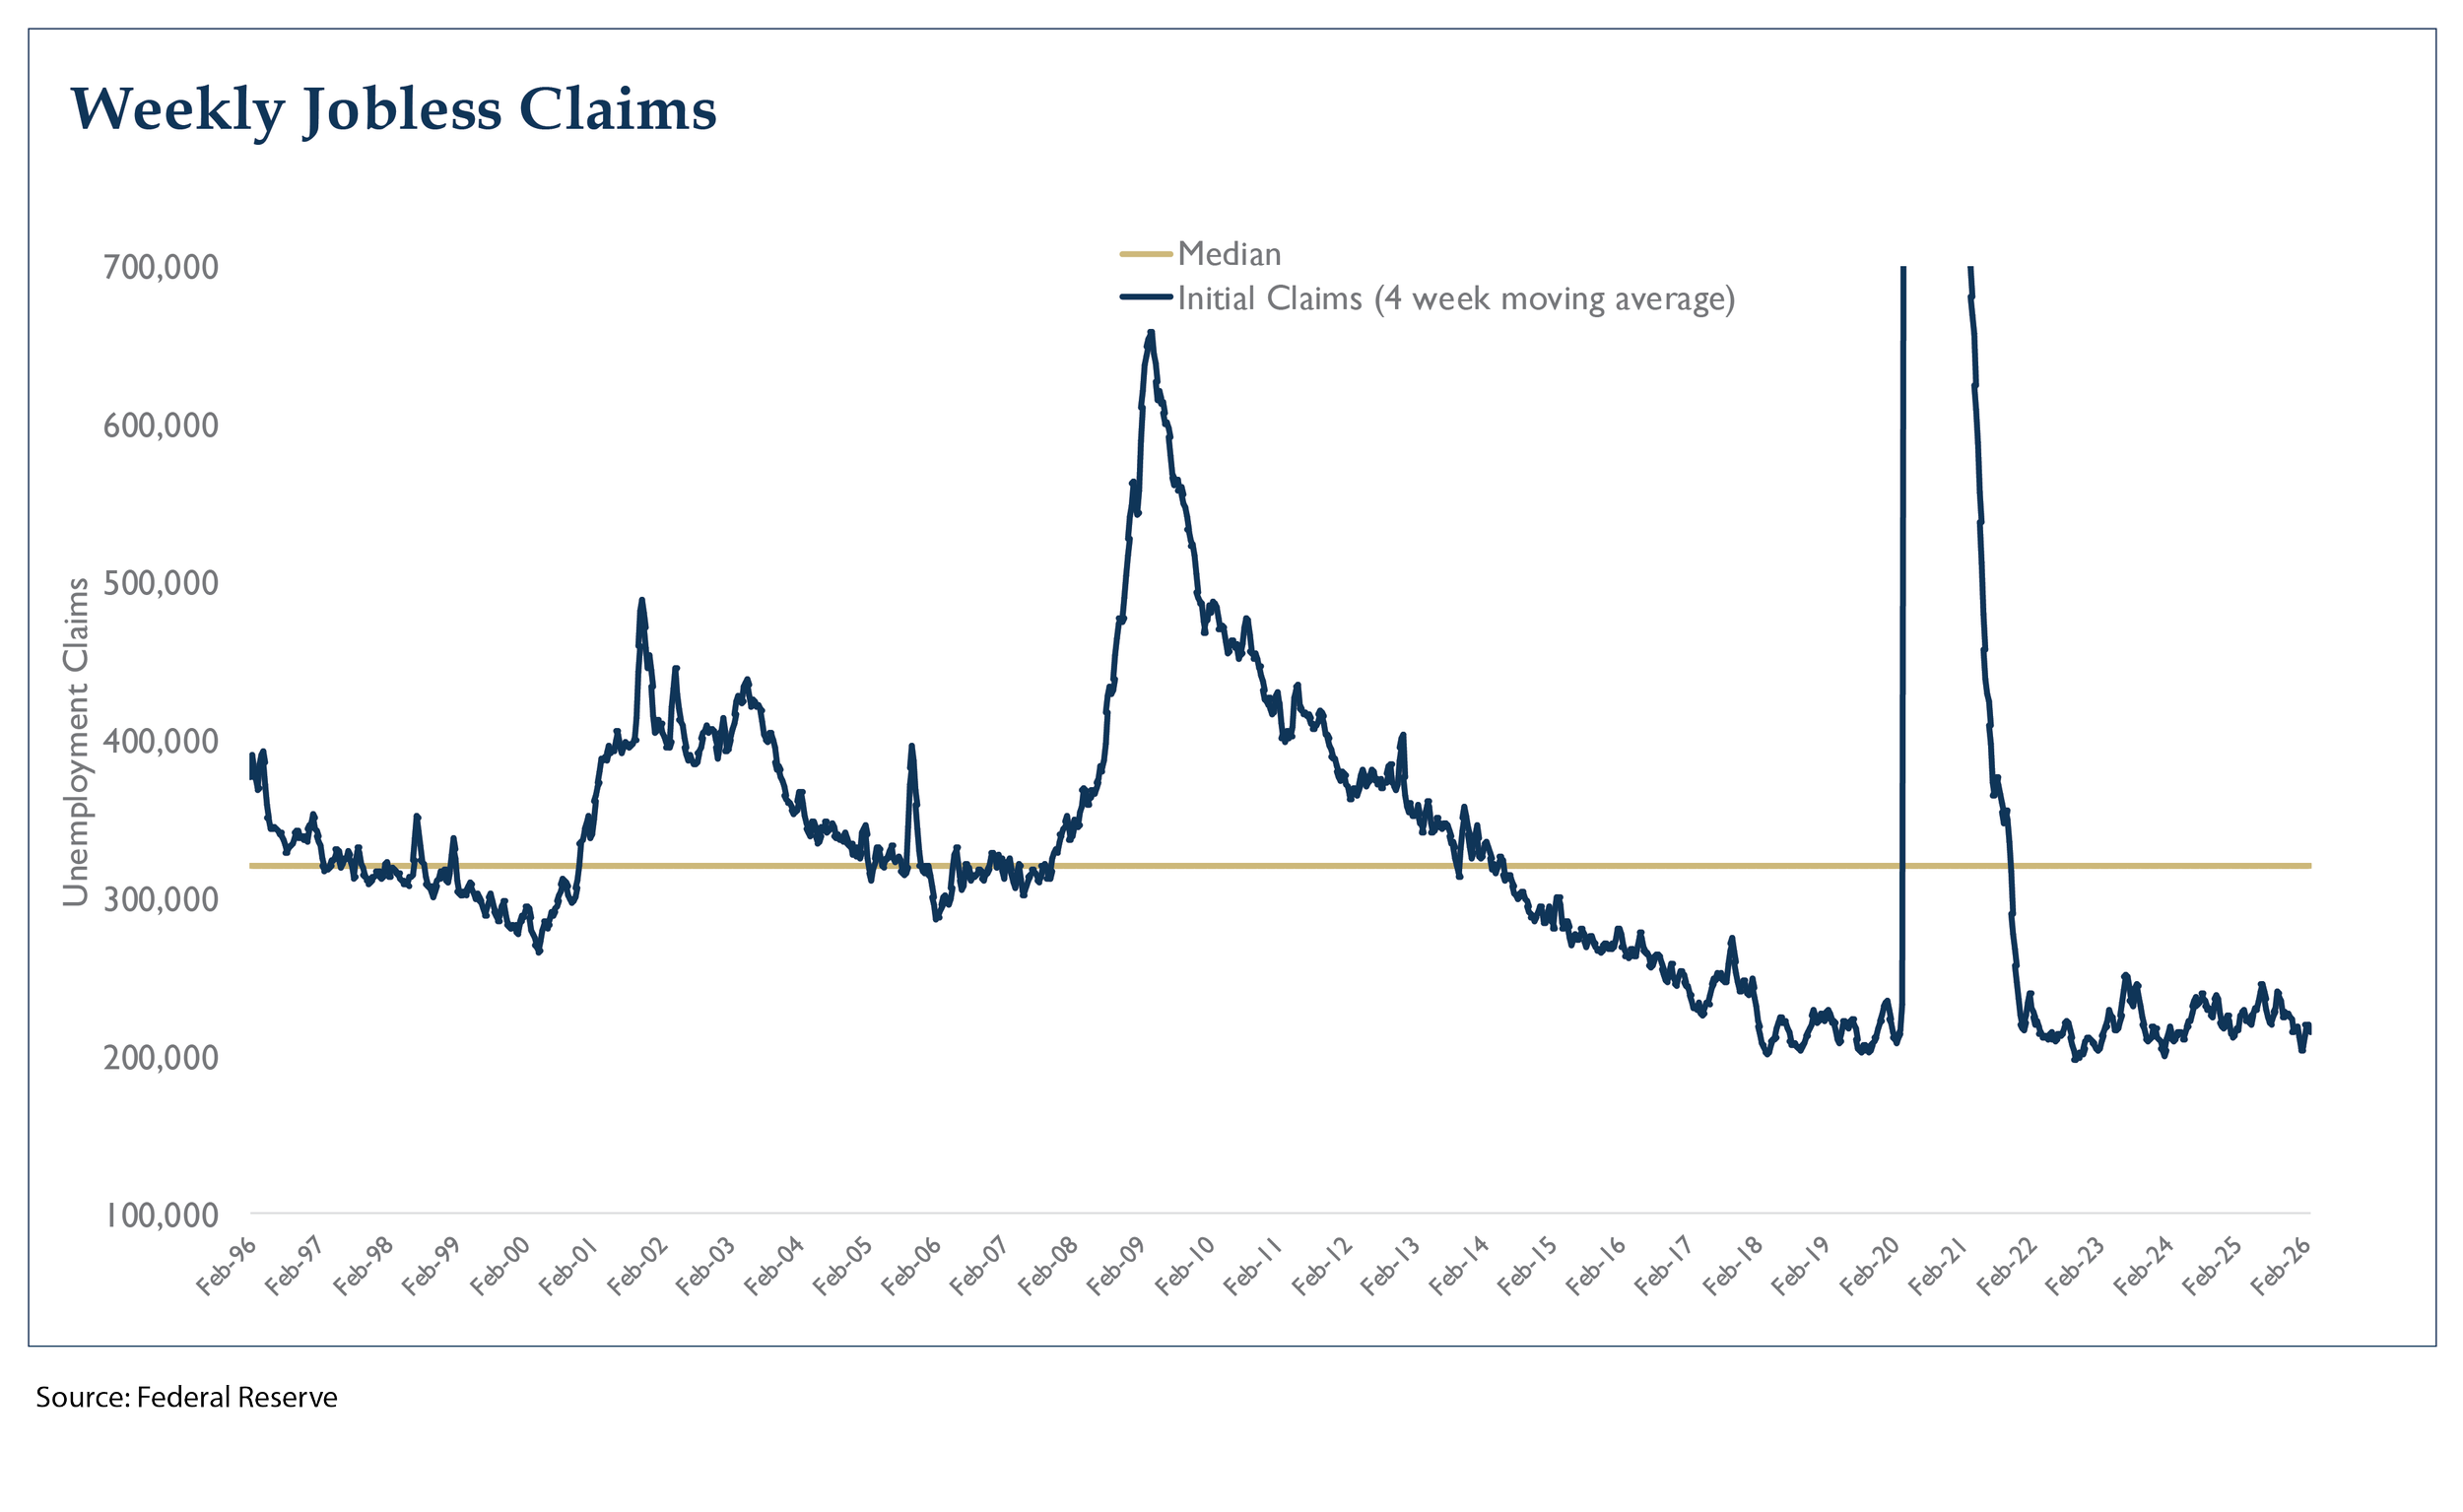
Friday’s jobs report was disappointing, showing a net loss of 92,000 jobs in February. Although month-to-month data can be volatile, we are paying attention to this diminished trend in hiring. Although hiring may not seem robust, layoffs are not increasing. On Thursday, the weekly jobless claims report showed people filing for unemployment continue to be 100,000 less than the long-term average, as seen in the chart below. We also saw hourly wages increase by 4%. The U.S. employment picture can be described as stagnant and we are monitoring any change in trend to gauge the strength in the consumer.
In November of 2025 we shifted most balanced client portfolios more defensively, reducing exposure to technology and increasing allocation to fixed income. Being broadly diversified is key for navigating environments like this. While volatility remains heightened, we are not likely to make any changes to client portfolios at this time.
Takeaways for the Week
While the S&P 500 finished the week down 2%, the index is still within 3% of its all-time high.
The bond market sold off this week as inflation fears crept into yields. The 10-year Treasury finished the week at 4.12%, up from 3.96% the previous week as concerns about high energy prices are impacting inflation expectations.
With 99% of S&P 500 companies having reported their fourth quarter earnings, we have seen results come in meaningfully above expectations. Estimates for average growth started at 8% and profits ended up growing by over 13%. Thus, 2026 earnings growth is now just under 15%, which is very supportive to the equity market