

This year, investors have wrestled with several paradoxical headlines: rising inflation, a tighter Fed, possible recession, a strong labor market and a healthy consumer. Unfortunately, the paranoia caused by these reports continues as markets wrapped up the first six months of 2022 with the S&P 500 down 20%, resulting in the worst start of the year since 1970. Since 1950, there have only been two worse first halves and unfortunately, there was nowhere for investors to hide – as highlighted in the chart below, the riskier the asset class, the worse performed.
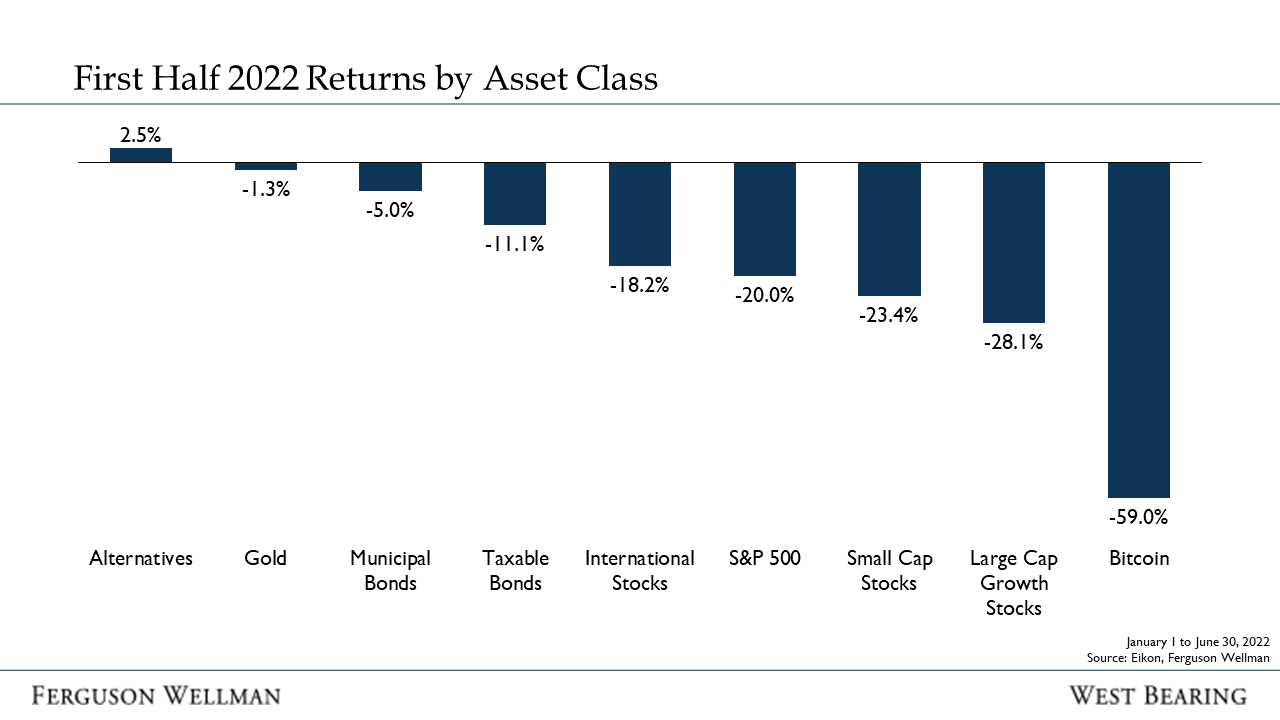
Source: Eikon, Ferguson Wellman
After close to 15 years of “cheap money,” some excesses have accumulated in the marketplace. Higher interest rates typically take the air out of these tumultuous moments and, while not enjoyable, periodically it is a necessary evil.
Bridge Over Troubled Water
The Federal Reserve’s preferred measure of inflation, the personal consumption expenditure index (core PCE), rose 4.7% for the month of May. This was better than expected as it followed the worse-than-expected consumer price index announced earlier in June. A telling portion of the core PCE data indicates that, while higher prices are affecting consumer spending, their incomes continue to grow. Consumers have begun deferring purchases due to rising costs and are increasing savings instead – a trend that is likely to continue through the summer. 70% of respondents to a mid-June Morgan Stanley survey indicated they are planning on cutting back spending the next few months, up from 60% two months previous. The majority of the increase came from those earning $50,000-to-$75,000 per year as high food and gas prices are starting to affect demand in this income cohort.
A gift to those consumers, this morning’s ISM Manufacturing Index showed some easing of inflationary pressures as supplier delivery times and backlogs are at their lowest levels in two years. This should ease the goods pricing over the next few months. The silver lining is that the U.S. economy is at full employment. Therefore, as inflationary pressures ease, the consumer will be healthy enough to begin to spend again.
Another key, real time indicator that financial analysts follow are jobless claims, which indicates the number of people filing for unemployment benefits. The data is released every Thursday and shows Initial Claims (or first-time claimants) and Continuing Claims, which indicates the longevity of unemployment. Both data series are at lows.
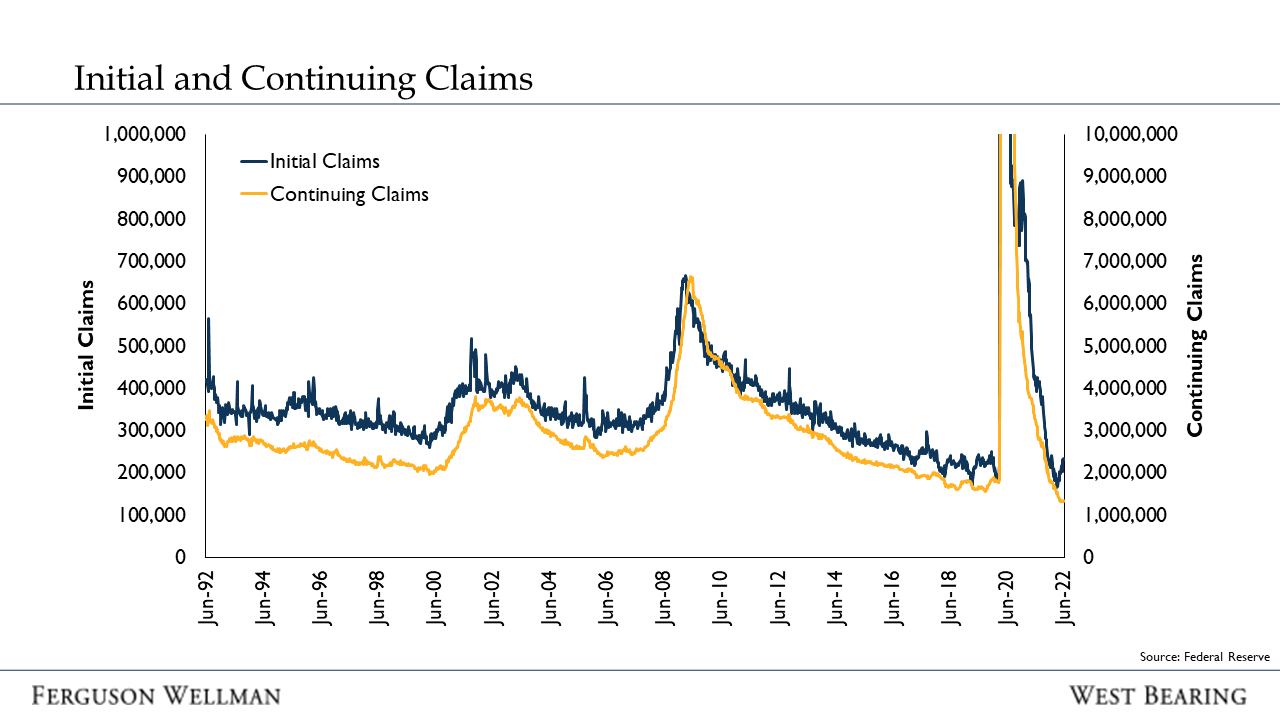
Source: Federal Reserve
While there has been a slight uptick in initial claims, it is still at historic lows. However, more telling is that Continuing Claims continue to fall. This indicates that, while the number of layoffs is increasing, those individuals are getting back to work in a short period of time. We’ve commented on the worker shortage in previous blog posts where the U.S. economy has roughly five million more job openings than people looking for work, therefore, there is still high demand for labor.
The troubled waters of higher rates and slowing consumer spending will hopefully be “bridged” by an employed consumer with growth wages and savings in the bank.
Takeaways for the Week
Even though stocks rallied over 1% on Friday, they still ended the week down 2%. This makes the 18th week out of 26 that that stocks have finished lower than where they began
Concerns over the economy or a better-than-expected PCE resulted in investors forecasting one less 25 basis point rate hike by the Fed and the 10-year U.S. Treasury Yield falling from 3.1% to 2.9%
“The real key to making money in stocks is not to get scared out of them.”