Belaboring Labor

Shawn-00397_cmykby Shawn Narancich, CFAExecutive Vice President of Research

Working for a Living

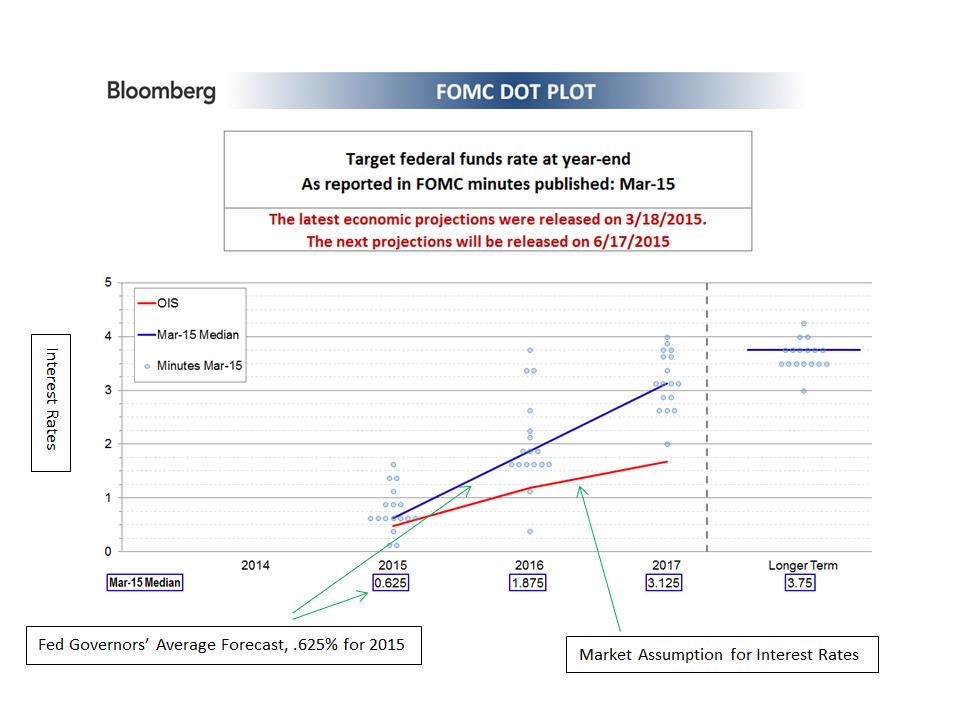
Investors unnerved by disappointing economic data of late breathed a sigh of relief with the April jobs report, which showed that nonfarm payrolls rebounded to a monthly rate of 223,000 last month. Unemployment dropped again and now stands at 5.4 percent, a rate not too far from the Fed’s definition of the full employment rate of unemployment (somewhere just north of 5 percent.) A “goldilocks” report of sorts that’s neither too hot nor too cold, the April payroll release supports the notion that the Yellen & Co. will likely begin the rate tightening process this fall. As policymakers and investors debate how tight labor markets actually are against a backdrop where the labor force participation rate hovers near its lowest level since the late 1970s, we are increasingly attuned to reported wage rates and the broader employment cost index (ECI). While wage gains remain muted at 2.2 percent in April, the ECI of 2.6 percent released last week demonstrated a notable uptick. When juxtaposed against anecdotal evidence of wage gains at fast food restaurants and retailers, our best guess is that the worm has turned with regard to employment costs this cycle. Because labor accounts for the predominant cost of doing business, the near-zero inflation rates we’ve seen of late appear likely to begin rising. When combined with the recent rebound in oil prices, headline inflation probably rises closer to the Fed’s 2 percent target by year-end.

Spring Forward

In contrast to the encouraging labor report, investors were greeted by a report showing that productivity of the U.S. labor force declined for the second consecutive quarter. While somewhat obscure, the statistic shines a light on the U.S. economy’s weak start to the year. By marrying employment and output statistics, the report tells us that the U.S. economy produced less per each hour worked in the first quarter. The reason productivity is such an important statistic is because when it’s combined with employment costs, it generates what we call unit labor costs. As alluded to above, sustained increases in the cost of labor are a key signpost for inflation, particularly when they translate into rising costs of production on a per unit basis. Just as importantly, unit labor costs determine how profitable companies are and the overall standard of living enjoyed by workers. Another tough winter combined with disruptions from the west coast ports strike put a damper on the U.S. economy in the first quarter, but we believe that an improving labor market, rising disposable incomes, and higher capital spending will engender a rebound of sorts in the second quarter. Commensurately, we would expect productivity to return to positive territory.

Exceeding Expectations

First quarter earnings season is just about finished and, once again, U.S. companies have done a remarkable job of under promising and over delivering.  Compared with expectations of a low single-digit decline in first quarter profits, corporate America is instead delivering earnings that should end up being marginally above levels of a year ago. In particular, while dramatically lower oil prices caused red ink to flow on the income statements of many energy companies, the damage was ameliorated by better downstream refining and marketing results and the quick pace with which oil and gas producers have right-sized their cost structure.

Our Takeaways from the Week

  • A solid April employment report bodes well for better economic times ahead
  • Another encouraging earnings season is just about finished


Taking a Bigger Bite Out of the Apple

by Jason Norris, CFAExecutive Vice President of Research

Apple reported earnings earlier this week. Due to recent strength in the stock, investors took profits. Specifically, sales grew 27 percent year-over-year, driven by 55 percent growth in iPhone revenues. This resulted in profit growth of 40 percent. These growth rates are very rare for companies with annual revenues over $200 billion and a market capitalizations (the share price multiplied by total number of shares outstanding) in excess of $700 billion. Therefore, sustainability does frequently come up.

On a similar note, with Apple’s market capitalization of $725 billion, it is now considered the highest valued company in the world. With that value, it is now 4 percent of the S&P 500, the most common equity benchmark. When active investors attempt to beat their benchmark, knowing some of the major constituents is critical for investment managers. In the case of Apple, if an investor believes that Apple is going to perform better than the S&P 500, they now have to allocate more than 4 percent of their portfolio to that stock. If they do not and Apple were to perform better than the S&P 500, investment managers will not keep up.

From a diversification standpoint, most investment managers are hesitant to hold positions greater than 4 percent, thus would now be underweight Apple. Since Apple is a very large component of the large-cap equity benchmarks, we recently reviewed the 10 largest actively managed core and growth mutual funds. For core managers trying to beat the S&P 500 when Apple is a 4 percent position, eight of 10 are underweight, and the other two are equal. When looking at growth managers when Apple is 7 percent of the benchmark (i.e., Russell 1000 Growth), nine managers are underweight and only one is equal. This data revealed that Apple is extremely underowned among the world’s largest mutual funds. If those funds were to move to an equal weight position relative to the benchmark, we would see over $29 billion worth of buying, which is roughly 235 million shares. Since we have a positive view on Apple, we believe this data is also positive.

Just like clockwork, this time of year the financial press will be prognosticating about the old adage, “sell in May and go away.” This comes to the forefront since equity markets often experience lackluster performance in the spring and summer months. However, it does not necessarily mean that investors lose money. Since 1978, from May to September, stocks median return was 3 percent, lagging the performance of equities from September to May. This has resulted in a median performance of 11 percent. We believe this doesn’t signal “a sell” since there are still positive returns to be had, just more potential volatility. The negative returns captured in the chart below are the result of two poor months, July and September.

Chart_5_1_15

Source: FactSet

Our Takeaways from the Week

o   Apple continues to be an "underowned" stock which may provide outside buying power adding support to the name

o   While summer is often a results in lackluster equity period for performance, we don’t think investors should trade based on the calendar

Disclosures

Ferguson Wellman Capital Management Ranked 32 on Forbes Magazine’s Top 100 Wealth Managers List

PORTLAND, Ore. – May 1, 2015 – Ferguson Wellman Capital Management was named by Forbes Magazine as a top wealth management firm. This is the third year that Ferguson Wellman was represented on the Forbes list. Specifically, Forbes named Ferguson Wellman 32nd on the “Top 100 Wealth Managers” list. The data for the rankings is provided by RIA Database and is based on the total discretionary assets under management by year-end 2014. Ferguson Wellman is the only firm to be named in Oregon and one of three firms listed that is located in the Pacific Northwest.

“We appreciate this recognition from Forbes,” said Jim Rudd, principal and chief executive officer. “We are fortunate to experience annual growth in assets and new clients, and we appreciate the work of everyone in our company who is focused on seeking investment excellence and earning lifelong relationships.”

Founded in 1975, Ferguson Wellman Capital Management is a privately owned registered investment adviser that serves over 700 clients with assets starting at $3 million. The firm works with individuals and institutions in 36 states with a concentration of those clients in the West. Ferguson Wellman manages $4.3 billion comprising union and corporate retirement plans; endowments and foundations; and separately managed accounts for individuals and families. In 2013, West Bearing Investments was established, a division of Ferguson Wellman, that serves clients with assets starting at $750,000. All company information listed above reflects 3/31/15 data.

###

Methodology From Forbes: Data for the Top Wealth Managers list is compiled by our partners at RIA Database. Candidate firms qualify based on both quantitative and qualitative criteria. This year we expanded the list to 100 firms, and ranked them by assets under management for year-end 2014, reported as of March 31, 2015. Members of the list must manage at least 50% of their assets on behalf of retail clients, can not run a broker-dealer (they can be affiliated with one), can not be a bank (trust companies are permitted), and must be performing wealth management services. Firms can not have had any regulatory, civil or criminal disclosures. The list looks beyond exclusively fee-only advisors because the RIA industry is evolving to incorporate more hybrid models as more representatives break away from broker-dealer models but carry along old business that includes some commission-based work.

http://www.RIADatabase.com.

“Forbes Top 100 Wealth Managers 2015” http://www.forbes.com/sites/steveschaefer/2015/05/01/top-wealth-managers-2015-investing-advice/

Note: Clicking on this link will take you to a third-party website. The information provided by this site is not endorsed or guaranteed by Ferguson Wellman. Clients should contact their portfolio manager with any questions about this topic. 

Moving Out

by Brad Houle, CFA Executive Vice President

In the month of March, sales of previously owned homes increased to 6.1 percent. Sales of 5.19 million homes is the highest level we’ve seen since 2013. At the height of the housing bubble prior to the great recession in 2008, existing home sales were as high as 7 million a month in the summer of 2005.

Following the 2008 crisis, existing home sales dropped as low as 3.5 million in June of 2010. While we will probably not see a return to 7 million homes sale in a month, the housing market is most certainly recovering. New home sales have followed a similar pattern, peaking prior to the crisis at 1.25 million in the summer of 2005 and now are averaging around 500,000 new homes per month.

Home sales are driven by new household formation as well as job growth. New household formation is defined as  individuals who are between the ages of 25 and 35 moving out of their parents’ basements to live on their own. While many people in the millennial generation prefer to rent, some are becoming first-time home buyers which is driving entry-level housing sales. Payroll growth has been robust with the unemployment rate dropping from 10 percent post-financial crisis to only 5.5 percent. There is a strong correlation with home sales and payroll growth as people become more secure in their employment … home sales follow.

Housing_Chart

Housing supply is low relative to historical rates with less than 5 months of supply. During the downturn, inventory ballooned to more than 12 months of supply. A lack of supply is driving prices higher in many markets also fueled by low interest rates.

Anecdotally there are tales of home buyer bidding wars in tight markets and other frenzied 2006 housing bubble behavior. According to the S&P/Case Shiller Home Price Index, home prices in the U.S. have only recovered 54 percent of the value lost since 2006. The most important difference between housing activity now and prior to the downturn is that lending requirements are much more stringent than in the past. Gone are the days of stated income loans, also known as liar loans, and no-money-down subprime lending. Lending requirements now require actual income and asset verification as well as a 20 percent  down payment.

Our Takeaway for the Week

o   Despite positive housing news, we do not think this industry is heading into bubble territory

Disclosures

Movin' On Up

by Ralph Cole, CFA Executive Vice President of Research

Movin’ On Up

U.S. oil production is finally starting to fall. After unrelenting production increases for the past several years, weekly oil production numbers have begun to decrease. In response to falling oil prices rig counts have dropped dramatically here in the U.S. The number of rigs operating in the U.S. is down 53 percent from the peak reached last year. This change has helped to drive West Texas Intermediate (WTI) oil prices back up to the mid-$50 range from a low of $43 just one month ago.

We would be remiss if we didn’t point out that the global demand for oil continues to rise. This is the other half of the supply-demand relationship that ultimately determines oil prices. The International Energy Agency (IEA) increased their expectations for global oil demand an additional 90,000 barrels per day, bringing their 2015 projected increase of daily oil demand to 1.1 million barrels per day.

No Expectations

Earnings season is a fickle, nuanced and fascinating time of year for portfolio managers. After each quarter of business, companies report their earnings and sales to analysts and the public. Companies guide investors to what they think earnings will be in future quarters. When a management team realizes that they are going to materially beat or miss their earnings guidance they announce it before the scheduled earnings release date which is called a pre-announcement. The pre-announcement ratio is calculated by taking the number of negative pre-announcements and dividing it by the number of positive pre-announcements by company. Strategas Research Partners calculates that the ratio is 6.2 to 1 this quarter, versus a long-term average of 2.73.  This is actually a very positive contrary indicator for the market. Companies have lowered expectations so much, that they usually end up beating the lowered bar. While this is only a short-term indicator, it may help explain positive stock movements on relatively weak earnings.

movin on up image

 Takeaways for the week:

  • Oil companies have drastically cut the number of oil rigs operating in the U.S., which will help improve the supply demand balance for crude oil in the coming months
  • The stronger dollar and lower energy prices have led companies to pre-announce lower earnings for the first quarter of 2015

Disclosures

Faulkner Receives Award from Portland Business Journal

Faulkner Receives Award from Portland Business Journal

Mary Faulkner, senior vice president of branding and communications, was honored by Portland Business Journal as a 2015 Woman of Influence Orchid Award Winner. 

Market Letter First Quarter 2015

Please click here to find our Market Letter First Quarter 2015. We hope you find our economic insights interesting and informative.  

Mastering Expectations

Shawn-00397_cmykby Shawn Narancich, CFAExecutive Vice President of Research

 A Tradition Unlike Any Other

 As another Masters golf tourney gets underway in Augusta, Georgia this week, investors are beginning to process the first reports of a dawning earnings season; as well, they have been jolted by a strong dose of deal news this week totaling well over $100 billion in announced acquisitions. Whether this flurry of activity heralds meaningfully more late-cycle deal making remains to be seen, but low interest rates as well as low oil prices support the rationale for energy deals like Royal Dutch’s $70 billion purchase of British energy company BG Group. Speculation is rife that rivals Exxon and Chevron could be compelled to do the same. Although buying another European producer might make more sense now in light of the strong dollar, we view neither of these integrated oil producers as likely to attempt a large deal for a major peer. More likely are deals for smaller independent U.S. producers with quality acreage in key Texas shale plays like the Permian Basin and the Eagle Ford.

Ready, Fire, Aim

As Royal Dutch jockeys for position in Big Oil, energy investors attempting to divine the low in prices for this cycle were forced to confront the not-so-shocking news out of Iran that that their “supreme leader” Khamenei is calling for the immediate lifting of economic sanctions in return for concessions limiting the country’s nuclear program. As well, he apparently disdains the idea of nuclear inspections that would confirm the country’s compliance with key provisions of the agreement reached in Switzerland last week. All of which leads us to conclude that predictions about a wave of new Iranian oil buffeting the markets any time soon is premature. From our perspective, the likelihood of reaching a final nuclear agreement with Iran looks increasingly unlikely.

Skating to Where the Puck Will Be

Geopolitics aside, we believe oil prices have bottomed and that markets will tighten meaningfully in the second half of this year, pushing prices closer to the marginal cost of production estimated to be somewhere between $75 and $100/barrel. From an investment perspective, we are overweight the energy sector and favor upstream producers and the service companies that enable their production as the two groups most likely to benefit from rising oil prices.

And They’re Off!

Alcoa marked the unofficial beginning of first quarter reporting season by announcing better-than-expected earnings on healthy growth in aluminum demand from both the aerospace sector as well as the emerging market in autos. Unfortunately for shareholders, the results met with a thud by investors who drove the stock down 3 percent on fears that aluminum prices will succumb to excess supply from China, the world’s largest producer. Next week will mark the first full week of earnings, with the money center banks and a few select industrial and healthcare companies on tap to deliver their numbers. In contrast to depressed energy results amid low oil prices, we expect earnings growth from sectors like healthcare and technology.

Our Takeaways from the Week

  • Deal making is being stimulated by low oil prices, low interest rates and a strong dollar
  • Investors are beginning to turn their attention to first quarter earnings


Pushin' Forward Back

by Jason Norris, CFA Executive Vice President of Research

The official start of earnings season kicks off next week and it looks like earnings for the broad market are going to be negative five percent. There are two main culprits for this. First, the recent strength in the U.S. dollar took large multinational companies by surprise, which resulted in major revenue and earnings revisions lower in 2015. The S&P 500, a standard large cap equity benchmark, has approximately 35-40 percent of its constituent’s revenues outside the United States. Therefore, a major strengthening of the U.S. dollar (see the below chart) results in U.S. goods being more expensive.

Chart

For example, if $1.00 = 0.80 Euro, then if a U.S. manufacturer were selling a $100 item in Europe, customers there would be spending 80 Euros. With the recent strengthening, $1.00 is now the equivalent of 0.95 Euros, thus that same $100 item would cost 95 Euros. This is a major price increase and headwind for U.S. exporters. We saw this instance with companies like Microsoft, Caterpillar, and more. On the other hand, the weakening Euro makes those products cheaper in the U.S. Thus, we believe European exporters should stand to benefit from this, and will be a catalyst to stimulating growth in Europe. As such, we recently increased our exposure to the International markets.

Down In a Hole

The other culprit for the major negative revisions for earnings is the reduction in the price of oil. In the past six months, the price of oil has been cut in half which is having a dramatic effect on the earnings in the oil patch. The year-over-year change in energy earnings in the first quarter is a negative 65 percent. Excluding this area of the market, earnings are forecasted to grow by three percent.

Outshined

These two attributes are setting up for a tough year for headline growth numbers. Earnings growth estimates have declined from seven to two percent for 2015. However, if you exclude Energy, earnings growth should come in closer to nine percent. Our belief is the overall economy is improving and the consumer will be the main beneficiary. While recent consumer spending data has been mixed, we are seeing an improving trend, particularly in consumer confidence. Therefore, continued low interest rates and energy prices throughout 2015 are a tax cut for consumers, and with a tightening labor market, we expect to see an increase in wages. This is all setting up to be a good year for “Main Street.”

Our Takeaways for the Week: 

  • The strong dollar and low oil prices are a headwind for US earnings growth
  • Main Street will be the winner in 2015

Disclosures

2015 Q1 Market Letter

2015 Q1 Market Letter

Volatility aside, 2015 is playing out much the way we anticipated. Europe’s central bank has graduated from talking about quantitative easing (QE) to actually delivering on it, and with $1.1 trillion of bond purchases planned for the next 18 months, markets

Connecting The Dots

by Brad Houle, CFA Executive Vice President

Last week's Fed announcement had something for everyone. The Fed removed the word "patient" from its forecast for increasing interest rates. This is an acknowledgement that the economic recovery is well underway and the strong employment data month-after-month is a confirmation of this fact. Taken in a vacuum, this change in the Fed’s message could be construed as being "hawkish" meaning that the Fed is in a hurry to raise interest rates to keep the economy from overheating. However, the Fed also dropped its own interest rate forecast which could be construed as being "dovish" meaning that the Fed is reluctant to raise interest rates. As a result, there was a strong rally in both the bond and stock markets which is what we mean by something for everyone.

The Fed's interest rate forecast or "Dot Plot" is a relatively new construct from the Fed. There has been a concerted effort to communicate more openly with the markets by the Fed. This endeavor was successful in the Bernanke-era Fed and has also been continued by the Yellen-era Fed. It is pejoratively called "open mouth policy” because what the Fed communicates to the market is ultimately as important as what the Fed actually does.

In the “Dot Plot” each Fed Governor posts their interest rate forecast on a chart which is then released with the minutes of the Fed meetings. Each dot is only one person’s opinion; however, the dots when taken in context, gives investors an idea of what the Fed Governors are thinking. Ultimately, these individuals have the ability to influence when short-term interest rates actually rise. Historically, when short-term interest rates have risen, longer-term interest rates have also climbed. Our research partner Bloomberg has done a good job illustrating what the Fed is trying to communicate with the "Dot Plot."

Blog chart

The blue line above represents an average of the Fed Governor’s forecasts for the next three years. These forecasts range from .625 percent for short-term interest rates by the end of 2015 to 3.125 percent by the end of 2017. The red line depicts what the market is discounting for interest rates over the next three years. The market discounts a number of different circumstances - both the Fed raising interest rates and not raising interest rates. This Federal Reserve forecast is assuming that rates are going to be raised. There has been much hand-wringing over when the Fed will actually act. Ultimately, when the Fed actually raises rates is unimportant. The important thing is that the economic growth is robust enough that rates should rise to keep the economy from overheating.

Our Takeaway for the Week:

  • We think short-term interest rates are going to rise. This is good news in that the economy is healthy enough that the Fed should act to keep it from overheating

Disclosures

Come Together

by Ralph Cole, CFA Executive Vice President of Research

Late last year we had a great chart that showed the Fed’s own expectations for tightening were ahead of the markets’ expectations for Fed tightening. We explained that as those two outlooks moved toward one another there would be volatility. On this past Wednesday, we experienced the positive aspect of that volatility.

Fed officials concluded two days of meetings in Washington and issued a statement regarding the economy and interest rates. While many were focused on the language used by the Fed, we were more focused on the Fed governors’ expectations for short-term interest rates in the coming year and the lowering of the theoretical “full employment rate”.

As part of Federal Open Market Committee (FOMC) meetings, each of the Fed Governors plots what they expect the Fed Funds rate to be at the end of 2015, 2016 and 2017. This chart has been referred to as “The Dot Chart”. The median expectations of the governors for Fed Funds at the end of 2015 actually came down from 1.125 percent to .625 percent. This means that the Fed Governors still expect to raise rates in 2015 (which we expect as well), but just not as quickly as they previously expected. This is more in line with what the market was hoping for; thus it was met with both a stock and bond market rally.

Untold Stories

Unemployment has been one of the most controversial topics of this economic expansion. The unemployment rate steadily moved down from 10 percent in 2009 to 5.5 percent in February. This rapid decline stood at odds with what many people felt they were experiencing in their own lives, and what was anecdotally highlighted in the media as well. What makes this more than a theoretical conversation is the unemployment rate’s effect on wages.

The most recent Federal Reserve study on employment came to the conclusion that the “full employment rate” for the U.S. economy was approximately 5.4 percent. The belief being that at 5.4 percent unemployment wages would start to rise or even accelerate. In the Fed’s statement today, they lowered the theoretical full employment rate for the United States to between 5.0 percent and 5.2 percent. Because we have not seen wages increase up to this point, they concluded that a lower level of employment would be needed to begin to pressure wages higher. This conclusion fits perfectly with the expectations of Fed Governors that the Fed Funds rate would not be increasing as much as previously expected. One company of note is Target, which announced this Thursday that they would be increasing wages for employees to at least $9/hour in April.

Takeaways for the Week:

  • The Fed continues to signal that they will be raising rates later this year, but at a pace that agrees with the markets’ assessment of our economic situation
  • Future Fed meetings and communications will cause increased volatility in the market

Disclosures

One Thing Leads to Another

Shawn-00397_cmykby Shawn Narancich, CFAExecutive Vice President of Research

Too Much of a Good Thing?

As Europe begins to make a down payment on its one trillion euro quantitative easing program, the U.S. dollar’s rapid gains have become parabolic and begun to take a dent out of investors’ U.S. stock portfolios. A strong currency is commonly cited for its endearing qualities of reducing inflation and attracting investment, but with the trade-weighted dollar up almost 25 percent since last summer, more and more companies are watching their bottom lines suffer as foreign profits get translated into fewer dollars. We would observe that when an asset’s orderly gains begin to rise at an accelerating rate, the asset is beginning to resemble a bubble, regardless of whether it is tech stocks in early 2000 or the dollar at present.

Bidding Adieu to ZIRP

Because the U.S. economy continues to outpace those of other developed nations at a time when the Fed is preparing to raise interest rates, we aren’t calling for a top on the dollar, but we do believe it is due for a breather. What we would conjecture is that the best of the greenback’s gains may have already been realized, acknowledging that while the Fed’s mandate to promote full employment is being realized, it is in danger of falling short of its other goal, that of maintaining stable prices (defined roughly as two percent inflation). We envision lift-off from the Fed’s zero interest rate policy (ZIRP) later this year, but with inflation increasingly subdued at the imported goods level in addition to that caused by lower oil prices, the Fed is unlikely to tighten as aggressively as the dollar would imply.

Skate to Where the Puck Will Be

We observe in bemused fashion the financial press waxing bearish about the supposed lack of storage capacity for U.S. oil production. Yes, storage builds have occurred at the Cushing, Oklahoma delivery site for the commonly quoted West Texas Intermediate (WTI) oil contract, as an unusually large amount of refining capacity has been temporarily idled for seasonal maintenance and one northern California refinery is offline because of the United Steelworkers’ refinery strike. This too shall pass. With gasoline refining margins now surpassing the robust level of $30/barrel (thanks to strong demand stimulated by low pump prices and discounted WTI oil), refiners are heavily incented to return idled capacity as soon as possible.

Always Darkest Before the Dawn

Are oil prices at a bottom today? Markets tend to overcorrect on the way up and do the same thing on the way down, so although fundamentals of the oil market don’t appear to support $45/barrel oil for any substantial length of time, the price of oil could go lower in the next month or two. But we don’t manage client portfolios with a one or two month time horizon and what we will say is that this cycle is playing out just like we would expect. U.S. drilling activity has plummeted in response to low oil prices, down 42 percent since September, while demand for gasoline, diesel and jet fuel hasn’t been this robust in years. By our estimation, faster demand growth and U.S. production that we believe is set to begin declining are the key ingredients to a recipe for higher prices in the second half of this year. Being overweight energy stocks has not felt good lately, but we are confident that the bearish headlines on oil herald something much more constructive for energy investors.

Our Takeaways from the Week

  • Increasingly heady dollar gains are beginning to negatively impact U.S. stock prices
  • The most recent declines in oil appear long in the tooth

Back in Time

by Jason Norris, CFA Executive Vice President of Research

In the last few weeks we have received several questions regarding the headlines coming out of Washington that may have major implications to some sectors of the market (although none of the questions were regarding Israeli Prime Minister Netanyahu’s address to Congress).

The FCC issued a statement that they are going to enact Title II of the 1934 Telecom Act (yes, 1934) to apply to broadband internet. This basically would regulate internet access, as well as any deals companies may make to transmit data (i.e., if Netflix were to strike a deal with Comcast, this would have to be blessed by the FCC). We haven’t seen the specific details of the act since the actual 300 page order has not been released. I had the good fortune of meeting with top managers of Verizon, Comcast and Charter Communications earlier this week and they addressed the topic. While the carriers have not been engaging in practices the FCC is trying to stop, this new regulation will introduce increased uncertainty. Network service providers have essentially had an open playing field as to what to invest in based on market dynamics. This proposed increase in regulation may present a lot of obstacles and conjecture. The consensus view is that new regulation would have a negative impact on innovation and investment longer-term. Also, the issue would be heavily litigated as well. The belief is that net neutrality needs to come through Congress, not the FCC. The DC Court of Appeals has previously overturned the FCC’s attempt to regulate in 2010 and 2014.

The winners of this move will likely be companies that drive a lot of data over the internet, i.e. Netflix and Hulu. Google is a wild card because they drive a lot of data transmission (YouTube) and they are expanding into telecom services (Google Fiber). Thus Google will see both the positive and negative sides of this proposed regulation. Apparently, Google execs had mentioned to President Obama that they are against net neutrality. The potential losers of the act would be the cable and telecom companies and their equipment suppliers if capital spending is slowed. However, the market didn’t bat an eye due to the amount of guesswork remaining before any implementation occurs.

You Keep Me Hangin' On

The Affordable Care Act (ACA) was before the Supreme Court again this week as challengers of the law asked the justices to find the subsidies (tax credits) the IRS is approving unconstitutional. The law states that only customers on a State-run exchange will get a tax credit; however, the IRS has been giving tax credits to all customers on both Federal and State exchanges. The majority of newly insured customers are on Federal exchanges and are receiving credits from the IRS, which would mean their insurance costs could increase meaningfully if this aspect of the ACA is overturned.

After the arguments were made on Wednesday, most legal analysts were unable to get a “read” from the justices on which way were they were leaning. The expectation is that the four “progressive” justices will vote in favor of the government, and the more “conservative” justices, Scalia, Thomas and Alito, will likely vote in favor of the plaintiff. The last challenge to the ACA was in 2012 where Chief Justice Roberts voted in favor of the act, so he could be the swing vote again. However, Justice Kennedy gave the defense a bit of hope due to his questioning of States’ Rights. The essential question is this: if the Federal government mandated the States to set up their exchanges to get its citizens subsidies, would that result in undue “coercion”? Thus maintaining the subsidies for the Federal exchanges may be allowed. It was an interesting line of questioning, and one that moved the HMO and hospital stocks this past week. The HMOs and hospitals will continue to be beneficiaries of the ACA due to the increased number of insured customers, but the HMOs will have less of a benefit since ACA policies dictate a lower profit margin.

Our Takeaways for the Week: 

  • Net neutrality will not be solved for some time due to the legal challenges at play
  • The current dispute of the ACA presents possible winners and losers in the healthcare sector

Disclosures

Negative Interest Rates: What Color is the Dress?

by Brad Houle, CFA Executive Vice President

In Europe there are now more than $4 trillion in bonds that have a negative yield, a number which is about 15 percent of the global bond market. The countries of Germany, Switzerland, Sweden, Finland and the Netherlands are all unfortunate members of this club for at least part of their respective yield curves. What this means is investors are paying a government such as Germany for the privilege of loaning them money. This is contrary to the concept of compound interest or the time value of money. In the investment profession we do not use the word "guarantee" as it can cause trouble with our chief compliance officer or possibly the SEC. However, with negative yielding bonds you are all but guaranteed to lose money except in the circumstance where the yield on the bond goes more negative. In this instance you can then sell the bond for more than you paid for it earning a small profit. This is a flimsy investment thesis at best.

Bond yields in Europe are negative for fear of falling inflation and the fact that the European Central Bank is purchasing large quantities of sovereign debt in an effort to hopefully stimulate the economy. All of this begs the question: who is buying these bonds with negative interest rates and why? Some bond managers are forced to buy negative yielding bonds due to flows of funds into the mutual funds they manage. For example, if the bond manager is managing an index fund that replicates the debt markets of countries experiencing negative yields and receives cash deposited in the fund, the manager is forced to invest in bonds in markets that are outlined in the prospectus of the fund. In addition, many investors are restricted to investing in very narrow slices of the bond market. Owning sovereign debt is important to banks due to regulatory capital requirements. This means that banks need to own high quality assets as part of their capital in order to makes loans to customers. For instance, it’s likely that a bank in Germany will need to own negative yielding German government bonds as capital.

The long-term implications of negative yields are unknown. This phenomenon has been exceedingly rare in history and has never been this widespread. We have received questions from clients as to the chances of this happening in the United States. Short-term treasury bills did go negative for a time during the financial crisis in 2008; however, we do not believe that we will see negative interest rates in the United States anytime soon. While it is possible, the U.S. has inflation of 1.6 percent, as measured by the Consumer Price Index last month, and the U.S. also has GDP growth of 2.2 percent. These facts would suggest higher interest rates as opposed to negative interest rates.

 Our Takeaways for the Week:

  • Risks of negative interest rates in the United States are low. Our economy is growing as evidenced by consumer spending in the United States. Household consumption grew by 4.2 percent year-over-year in the fourth quarter of 2014. Consumer spending, which comprises 70 percent of the economy, has been robust due to a strong labor market and falling gas prices

Disclosures

Take Your Time

by Ralph Cole, CFA Executive Vice President of Research

Take Your Time

Greece and Euro Area finance ministers reached a tentative agreement Friday to buy time for Greece to get their financial house in order. The EU has agreed to provide liquidity for up to four additional months if Greece provides a sufficient list of measures they are willing to undertake.1

Greece will have a primary budget surplus in 2015 which means they will have a budget surplus - if you don’t count debt payments. While this may seem unrealistic, it does mean the Greek government could continue to operate if they stop paying their creditors. However, this would not be in the best interest of anyone. Greek bonds would drop in value, as would some of the bonds of other peripheral countries. This situation is known as financial contagion. Greece in and of itself is not a huge economy (it is approximately the size of Indiana), but the world is trying to judge the effectiveness the European Union. Can they hold it together?

We believe that the EU can indeed keep it together in the near-term. In the future, it may be in the best interest of some countries, Greece as one example, to move out of the Eurozone. If a country finds itself politically unable to work within the confines of the European Union, they may want to exit the agreement in order to control their own budgets and currency. The EU would rather have this happen during a time of strength, rather than at a time of ongoing economic stress.

Waiting on a Friend (Fed)

The Federal Reserve board meeting minutes were released Wednesday and markets deemed them to be dovish; meaning that the Fed is afraid of raising rates too soon and choking off a fragile recovery. The surprise to us is that people continue to refer to this as a recovery. Both U.S. GDP and the S&P 500 are at all-time highs and the U.S. passed through recovery territory years ago. While nothing is a foregone conclusion, we believe the Fed will raise rates later this year. There will be a lot of hand wringing over the first Fed rate hike (there always is), but we believe the economy is on very sound footing and can handle higher rates. While it could happen in June, it will most likely happen in the second half of the year. This topic will be discussed ad nauseam throughout the year, but we view tightening as a positive. A rate hike will be a signal to the markets that the financial crisis is officially behind us and extraordinary measures of liquidity are no longer needed.

Takeaways for the Week:

  • The Greek debt story is not over, but they do have more time
  • We expect the Fed to raise rates later this year

1 Source: Bloomberg

Disclosures

S&P: 500 Shades of Profit

Shawn-00397_cmykby Shawn Narancich, CFAExecutive Vice President of Research

S&P: 500 Shades of Profit

Blue-chip U.S. stocks are again in record territory, reminding investors of the powerful backdrop that near-universal easy money policy has in keeping the capital markets liquid. The start to 2015 shares parallels with the same period last year, when growth worries precipitated by a severe winter domestically and concerns about Fed tapering gave way to a better economy in the second half of the year. This time around, a seemingly intractable conflict in eastern Ukraine, our next installment of the Greek funding drama and fears of the effects of a strong dollar on fourth quarter profits combined to put a chill in markets to begin the year. But once again, stocks have climbed the proverbial wall of worry as fourth quarter profits have come in better than expected, a new truce in eastern Ukraine between government forces and Russian sponsored rebels was reached, and the new leaders of Greece practice the well-worn art of brinksmanship. The result for fixed income investors is reduced returns as benchmark Treasuries have lost some of their flight-to-safety bid.

Ringing the Cash Register?

With gasoline prices having plunged to the $2.00-per-gallon level, investors could be forgiven for expecting a better retail sales report than that which was delivered for January. Lower gas prices have freed up well over $100 billion of disposable income for the U.S. consumer, so why have retail sales declined for two consecutive months? Clearly, the math of lower fuel prices dampens the headline number, but the expectation is that savings at the pump will be spent elsewhere. Some of the explanation appears to reside in historical data showing that consumers don’t immediately spend windfalls from sources such as tax rebates and savings at the pump and, in deference to the latter, our opinion is that low energy costs will prove to be fleeting. Notwithstanding our skepticism about today’s low price of oil, we would observe that the U.S. consumer is in great shape, benefitting from faster job growth, benign inflation overall and the wealth effect from higher home prices and values of investment portfolios. So despite weakness in the past couple retail sales reports, we believe it’s premature to give up on the U.S. consumer. In fact, we believe consumption expenditures will lead the economy to new record highs in 2015.

Glimmers of Hope in Europe

Despite being disadvantaged by rigid labor laws that prevent free hiring and firing and excessively high tax rates the Continent’s sluggish economy picked up ever so slightly in the final quarter of last year. While a 1.4 percent growth rate is nothing to write home about, it beats recession. It also acknowledges the salving impact of low European interest rates and fuel costs, a dramatically weaker euro that has stimulated export, and tentative labor market reforms in Spain that have begun to have their intended effect. Meanwhile, Germany remains Europe’s economic engine and primary beneficiary of the weaker currency. European investors cheered the economic news and positive developments on the geopolitical front by bidding blue-chip shares there to new 7-year highs.

As the sun begins to set on another earnings season, we feel reasonably good about the results that have been delivered. For the most part, U.S. companies have done a solid job offsetting strong dollar headwinds with continued efficiency gains and additional sales from a relatively healthy U.S. economy.

Our Takeaways from the Week

  •  As another decent earnings season begins to wind down, U.S. stocks are back at record highs
  •  Disappointing retail sales in January are likely to give way to healthier gains ahead

Disclosures

Oregon State University Honors Jim Rudd and Other Volunteers

Oregon State University Honors Jim Rudd and Other Volunteers

Four Oregon State University volunteer leaders who have played key roles in the university’s advancement will be honored at the Destination OSU awards banquet in Scottsdale, Arizona, on Friday, Feb. 20. Honorees are James H. Rudd of Lake Oswego; Suzanne Phelps McGrath and Bernard K. McGrath of Portland; and Harold Ashford of Bend.

Liquid Courage

by Jason Norris, CFA Executive Vice President of Research

Volatility increased this past week in most asset classes with oil being in focus. In the last two weeks, crude oil is up roughly 20 percent, its best two-week move in 17 years. While the demand picture has not changed, we have seen U.S. oil and gas companies announce major employment cuts and capital expenditure reductions for 2015. We believe that there has been some “short covering” in the market which has led to recent strength. Our belief is that by year-end, oil prices will be between to $60-$70/barrel, due to reduced supply in the U.S. In the face of this, we do believe we see some opportunity in energy stocks. While earnings continue to come down, we think we can find value in select names with strong balance sheets.

All Over the Road

As mentioned earlier, the energy complex was not the only asset class exhibiting volatility. In the first five weeks of 2015, the S&P 500 has been either up or down more than 1 percent 11 times, which is 44 percent of the trading days. To put it in perspective, last year the S&P 500 moved this much only 15 percent of the time. The chart below highlights the last five years.

Days the S&P 500 Was Up or Down More Than 1 Percent

2011 2012 2013 2014 2015
Number of Days 96 50 38 38 11
Percent of total trading days 38% 20% 15% 15% 44%

Source: FactSet

This year is setting up to be similar to 2011, a year that  saw a lot of uncertainty due to surprisingly poor U.S. GDP growth, a U.S. debt downgrade and the European crisis coming to the forefront. All this uncertainty resulted in a flat market for 2011, but it was a rollercoaster ride. We believe the fundamentals of the U.S. economy and the recent actions of the European Central Bank leave the foundation of the global economy a little firmer. We don’t think the volatility mitigates itself; however, we do believe that equity returns will be better than 2011.

Working for the Weekend

Heading into a wet weekend on the west coast, the monthly jobs report this morning was very strong with the U.S. economy adding 257,000 jobs in January. The unemployment rate ticked up to 5.7 percent due to an increase in people looking for jobs, which is a positive for the economy. This is only a small part of the story. Job gains for December and November were revised higher by 147,000. The third leg of the stool of the January jobs report was an uptick in wages. Wages bounced back after a disappointing December, rising 0.5 percent month-over-month. With a strong labor market and unemployment close to the Fed’s target, we believe this wage growth will persist throughout 2015. This further reinforces our view that 2015 will be a good year for “Main Street.”

Our Takeaways for the Week: 

  • Main Street will fare better than Wall Street in 2015
  • Adding to high quality energy names at this time could pay dividends in 2015

Disclosures