


by Brad Houle, CFA
Executive Vice President
In financial news, there has been considerable discussion regarding the possibility of an inverted yield curve. As a data point we follow closely, we’d like to share its potential impact on the economy, capital markets and investors.
What is a yield curve?
The yield curve is a graphical depiction of the yield structure of U.S. Treasury bonds across the range of maturities. The government issues bonds to finance operations with maturities from one month to 30 years. The rate of interest on longer bonds is set by the market. Short-term interest rates are heavily influenced by the federal funds rate, which is set by the Federal Open Market Committee (FOMC).
How is the yield curve normally shaped?
More times than not, the yield curve has a positive slope. Said differently, short-term rates are generally lower than longer-term interest rates. Intuitively this makes sense for bond buyers because they are loaning money to the U.S. government. As an investor in bonds, it is reasonable to expect a higher rate of interest for loaning your money for 30 years compared to a few months to compensate for the uncertainty of lending for a long duration. After all, changes in interest rates and inflation make returns on bonds over a longer period of time less certain than shorter periods of time.
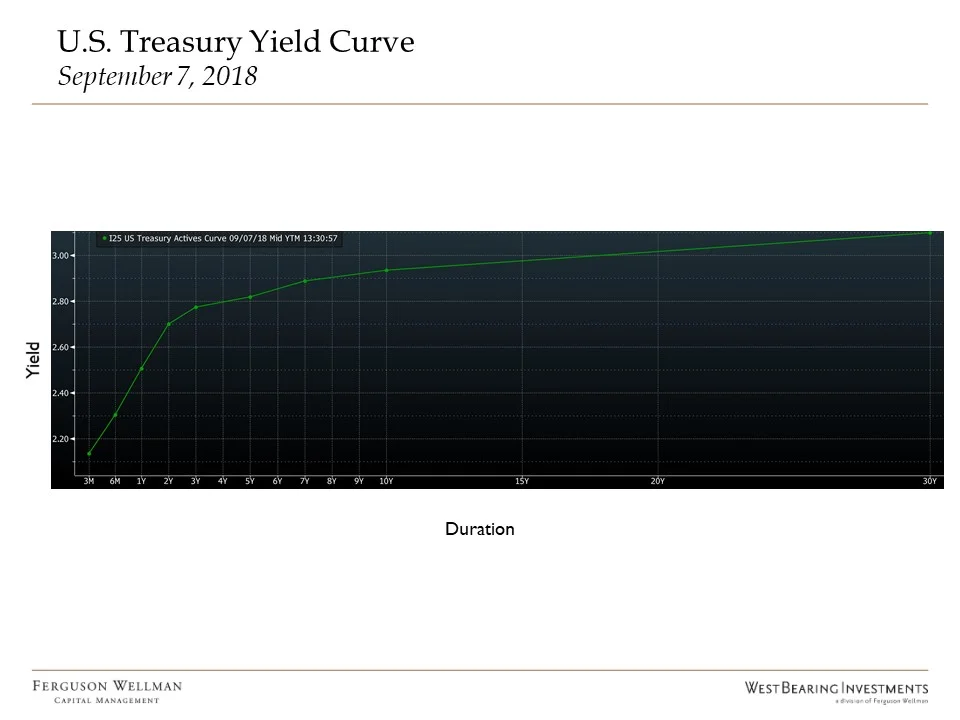
How is the yield curve currently shaped?
The yield curve has flattened dramatically this year. What this means is that short-term interest rates have risen more than longer-term interest rates. In part, shorter-term interest rates have increased due to the Federal Reserve increasing the federal funds rate in order to keep the economy from overheating. The slope of the yield curve is measured by the difference between the two-year Treasury and the 10-year Treasury. Right now, the 10-year Treasury yield is at 2.93 percent versus 2.69 percent for the two-year Treasury or a difference of .24 percent. For comparison, the long-term average of the 10-year Treasury yield versus the two-year Treasury yield has been much wider at about .90 percent since 1980.
Source: Bloomberg
What are the implications if the yield curve were to invert?
Historically, an inverted yield curve has been an indicator that a recession is on the way. The yield curve did in fact invert prior to each of the past five recessions. On average, a recession lagged the inversion of the yield curve by about a year. That said, there are several factors that might make this less of a clear recession predictor. Currently, global interest rates are artificially low due to central bank buying in Europe and Japan. This has created an appetite for foreign investors to purchase U.S. Treasury securities which have the highest yields in developed markets. This phenomenon is most likely holding down longer-term interest rates while the Federal Reserve slowly increases short-term interest rates. We will continue to monitor this situation closely.
Week in Review and Our Takeaways
- The emerging market sell-off and tariff news led to a risk-off week with the S&P 500 finishing down about 1 percent
- Employment data for August was stronger than expected with nonfarm payrolls increasing by 201,000 jobs, which was slightly higher than expected. Unemployment remained at 3.9 percent, which is in-line with consensus views
- Average hourly earnings saw a surprise 2.9 percent increase, which was higher than expected and led to a Treasury bond price decline and the 10-year yield climbing to 2.93 percent
- The yield curve has flattened, but has not yet inverted. Even if the yield curve does invert, it does not mean that a recession is imminent